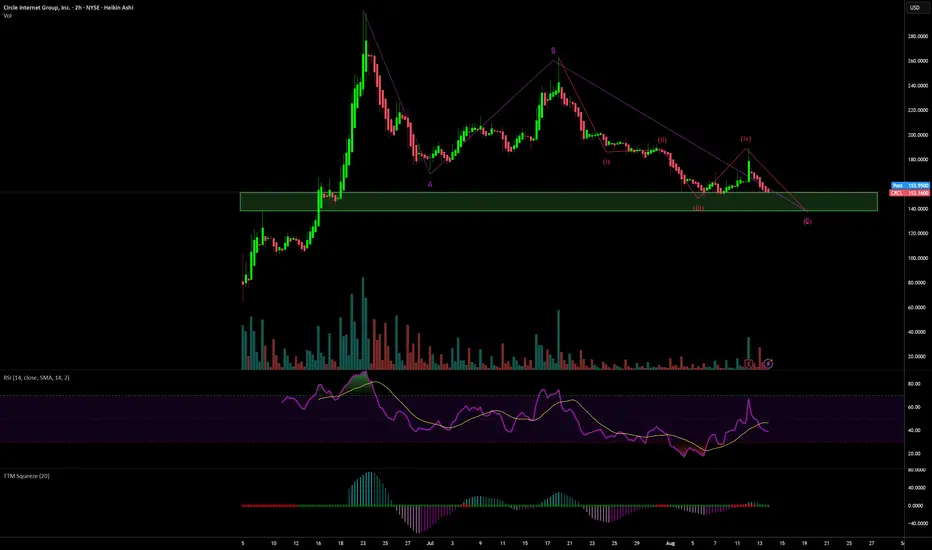
With the announcement of the new stock release, more selling should come. I see limit entries of 139 and 144 to be ideal. Overall pattern is 4th wave correction IMO. Target at least double top in short term and much higher long term. People smarter than me would put stop losses under those targets, but I'm a degen. Any accumulation in the green box should be good.
Note
Not sure how to add a picture here, so link to updated chart.
I still think 139 was the idea entry here, but wanted to add an alternative take. Instead of this being a 4th corrective wave, I think it could very likely be a larger 2nd corrective wave. This will be determined if price action breaks below the height of the "1st" wave of 139. If it does and 139 doesn't hold, then the picture of this being a second larger corrective wave looks likely. In this case, even though 2nd waves can sometimes correct to the the base of the 1st in extreme cases (not likely in this case due to fundamental speculative case), then a deeper retracement to the .789 Fibonacci is likely and ideal entry changes to 115.
Disclaimer
The information and publications are not meant to be, and do not constitute, financial, investment, trading, or other types of advice or recommendations supplied or endorsed by TradingView. Read more in the Terms of Use.
Disclaimer
The information and publications are not meant to be, and do not constitute, financial, investment, trading, or other types of advice or recommendations supplied or endorsed by TradingView. Read more in the Terms of Use.