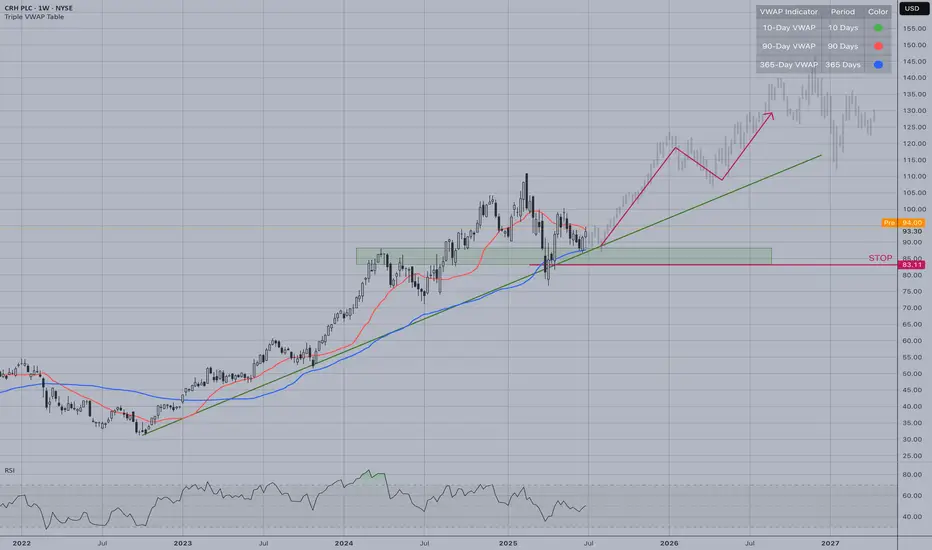
The CRH PLC weekly chart displays a strong uptrend continuation pattern.
Key Technical Observations:
Price successfully broke above the green support zone and is maintaining momentum
The ascending trendline (green line) acts as dynamic support, reinforcing bullish structure
Multiple VWAP indicators show healthy institutional participation across different timeframes
RSI remains in bullish territory without reaching overbought levels
Trade Setup:
Entry: Now
Exit: Clear break of trendline
Risk Considerations:
The projected upward path (red arrow) suggests continued strength, but traders should monitor for any breakdown below the ascending trendline.
Find top crypto tokens with sector indices, AI-powered sentiment analysis & news summaries.
tokenradar.ai/tv
tokenradar.ai/tv
Disclaimer
The information and publications are not meant to be, and do not constitute, financial, investment, trading, or other types of advice or recommendations supplied or endorsed by TradingView. Read more in the Terms of Use.