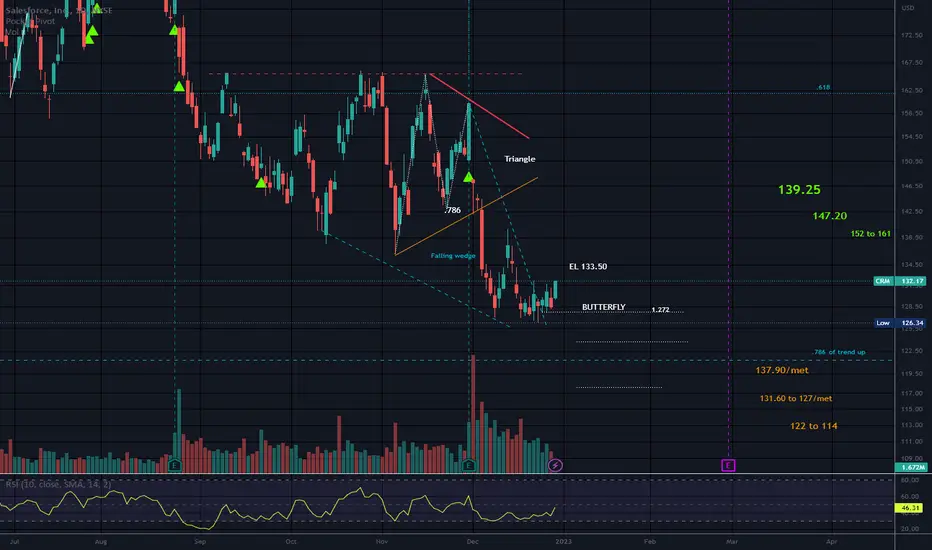
A bullish Butterfly is shaped like a crooked M. The 2nd leg pulls to the .786 and the 4th leg pulls close to the 1.272.
Peak 2 is lower than peak 1.
A falling wedge is opposite of a Rising wedge and both trendlines slope Down with the prevailing trend and narrow at the apex.
Price is between the .786 and the .618 of the trend up since the Covid low.
Since we are most likely in a Bear market, bullish patterns will be more apt to fail that bearish patterns.
Resistance overhead.
Short interest is less than 1%
No recommendation
Disclaimer
The information and publications are not meant to be, and do not constitute, financial, investment, trading, or other types of advice or recommendations supplied or endorsed by TradingView. Read more in the Terms of Use.
Disclaimer
The information and publications are not meant to be, and do not constitute, financial, investment, trading, or other types of advice or recommendations supplied or endorsed by TradingView. Read more in the Terms of Use.