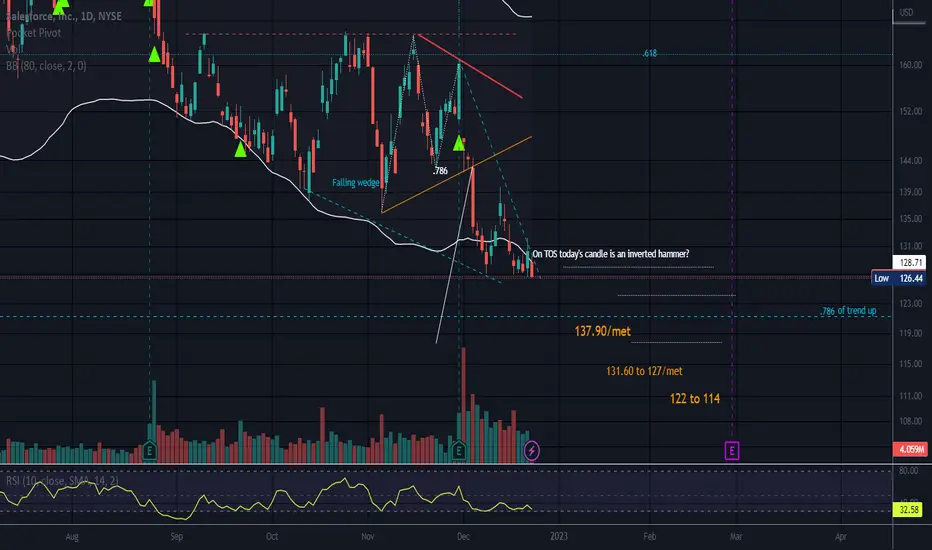
Price has busted the support line of the triangle (orange line).
Salesforce, Inc. has killed portfolio performance for over a year now and is still looking for a bottom.
I guess everything has a top and everything has a bottom.
There are 5 candles that have hit a low at this level, but price can still sail through this level like a missile on a bad market day like today.
I see a possible M The 2nd leg pulled to the .786 of the 1st leg. Leg 4 has hit the 1.272 and is where the 5 candles stopped but it does appear price is continuing to make new lows today. OUCH!
Falling wedge noted. A Falling wedge /blue/ is opposite of a Rising wedge and can be bullish . It is often found at the exhaustion level of a downtrend. The top trend line would need to be broken and price can also break down from a Falling wedge . The trendlines a falling wedge both slope down and narrow at the apex.
Short interest low at around 1%.
5 year low is 101.32. 3 year low is 115.29.
It just seems CRM may form a basing pattern soon like a triangle or a rectangle . Time will tell.
Today's candle differs here from the red inverted hammer that I see on TOS . This candle needs confirmation but one of the 2 platforms is incorrect.
An inverted hammer looks like a shooting star but the inverted hammer is found closer to bottoms whereas shooting stars are found at tops and are bearish .
A hammer at the bottom can look like a Hanging man at the top.
No recommendation.
Disclaimer
The information and publications are not meant to be, and do not constitute, financial, investment, trading, or other types of advice or recommendations supplied or endorsed by TradingView. Read more in the Terms of Use.
Disclaimer
The information and publications are not meant to be, and do not constitute, financial, investment, trading, or other types of advice or recommendations supplied or endorsed by TradingView. Read more in the Terms of Use.