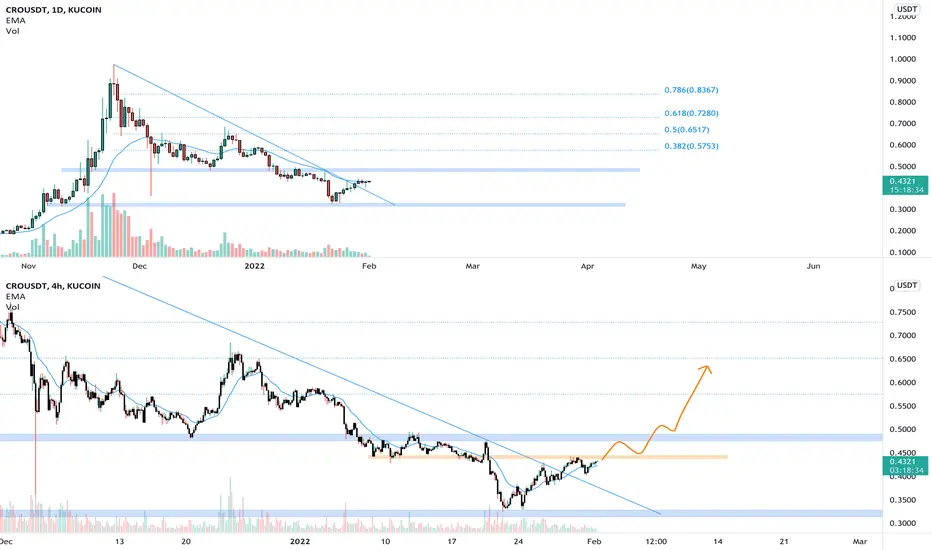
The price retested the key level on the 0.35$ and create a double bottom on the 4h timeframe (lower chart)
Now the price is creating the higher lows and it's testing the 4h resistance.
How to approach?
If the price is going to have a breakout from the 4h resistance and daily resistance, we could see a bullish impulse until the 0.5 Fibonacci level (0.65$)
According to Plancton's strategy, we can set a nice order
–––––
Keep in mind.
–––––
Follow the Shrimp 🦐
Now the price is creating the higher lows and it's testing the 4h resistance.
How to approach?
If the price is going to have a breakout from the 4h resistance and daily resistance, we could see a bullish impulse until the 0.5 Fibonacci level (0.65$)
According to Plancton's strategy, we can set a nice order
–––––
Keep in mind.
- 🟣 Purple structure -> Monthly structure.
- 🔴 Red structure -> Weekly structure.
- 🔵 Blue structure -> Daily structure.
- 🟡 Yellow structure -> 4h structure.
–––––
Follow the Shrimp 🦐
Note
The price is testing the 4h resistance.We are waiting for the breakout from that area to apply our rules for a new long position
Disclaimer
The information and publications are not meant to be, and do not constitute, financial, investment, trading, or other types of advice or recommendations supplied or endorsed by TradingView. Read more in the Terms of Use.
Disclaimer
The information and publications are not meant to be, and do not constitute, financial, investment, trading, or other types of advice or recommendations supplied or endorsed by TradingView. Read more in the Terms of Use.