## Views on the Crude Oil Futures Chart (MCX)
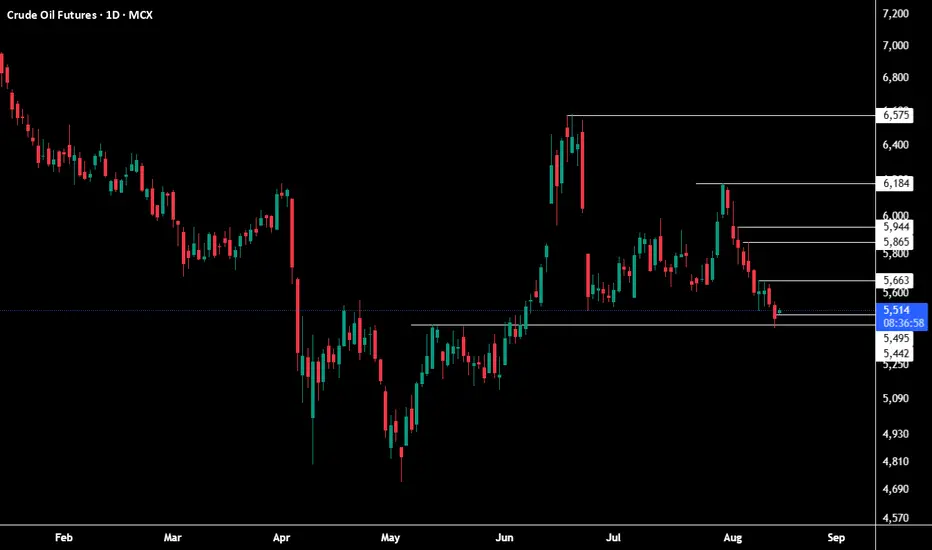
This chart represents daily price action for *Crude Oil Futures* on MCX as of August 14, 2025. Here are some key observations and insights:
### Price Action & Trend
- The trend since February shows an initial *downward movement, followed by a significant **reversal and uptrend* from late April to June.
- After peaking above 6,500 in June, prices have retraced and entered a *sideways/consolidation phase*.
### Key Technical Levels
- *Support levels*: 5,506 (current), 5,495, and 5,442. Price is currently testing a major horizontal support zone. A breakdown below these could trigger further bearish momentum.
- *Resistance levels*: 5,663, 5,800, 5,865, 5,944, 6,184, 6,575. These are potential areas where price may pause or reverse on an upward move.
### Candlestick Analysis
- The latest candle signifies a bounce off the 5,506 support with slight bullish intent (close is above open), but there’s visible bearish pressure in recent sessions.
### Volume & Sentiment
- Volume for the session stands at 5.04K—slightly increased, indicating active participation around this key support level.
### Summary & Outlook
- If prices sustain above the *5,500 support zone*, a rebound towards 5,663 and higher resistance levels is possible.
- If the 5,500 zone fails, expect a move towards lower supports at 5,495 and 5,442.
- Watch for strong bullish candles or volume spikes to confirm any reversal.
*Note:* This analysis is graphical and technical in nature. Actual trading decisions should account for broader market context and news events, as technical levels can be invalidated quickly in volatile markets.
Disclaimer
The information and publications are not meant to be, and do not constitute, financial, investment, trading, or other types of advice or recommendations supplied or endorsed by TradingView. Read more in the Terms of Use.
Disclaimer
The information and publications are not meant to be, and do not constitute, financial, investment, trading, or other types of advice or recommendations supplied or endorsed by TradingView. Read more in the Terms of Use.