Cisco  CSCO is set to release fiscal Q4 earnings next week at a time when the tech giant has gained some 30% since its April low and more than 50% over the past 12 months. What does Cisco's fundamental and technical analysis say could happen next?
Let's check things out:
Cisco's Fundamental Analysis
Cisco plans to unveil earnings after the bell on Wednesday (Aug. 13), with the Street looking for $0.98 in adjusted earnings per share on $14.6 billion of revenue.
That would represent a 12.6% gain on the $0.87 in adjusted EPS that CSCO reported in the year-ago period, as well as about 7% growth from Q4 2024's $13.6 billion in revenue.
Of the 19 analysts that I found that cover CSCO, 16 have increased their earnings estimates since the latest quarter began, while just one has revised their estimate lower. (Two kept their estimates unchanged.)
Cisco has enjoyed several seemingly positive catalysts recently. Just last week, J.P. Morgan's Samik Chatterjee reiterated his "Buy" rating on CSCO while raising the stock's target price to $78 from a previous $67.
Matthew Nikham of Deutsche Bank also recently upgraded Cisco to a "Buy" from a "Hold," while boosting his price target to $73 from $65.
And last month, Bank of America included the stock in its top 10 ideas for the third quarter – interestingly, a list that wasn't crowded with tech stocks.
There were none of the "usual suspects" on the list -- no "Magnificent Seven" names and no elite GPU designers. Cisco and Datadog (DOGG) were the only tech stocks that I saw.
Cisco's Fundamental Analysis
Ironically, Cisco had been rallying from early April right up until the point where the analyst community seemed to jump on the bandwagon.
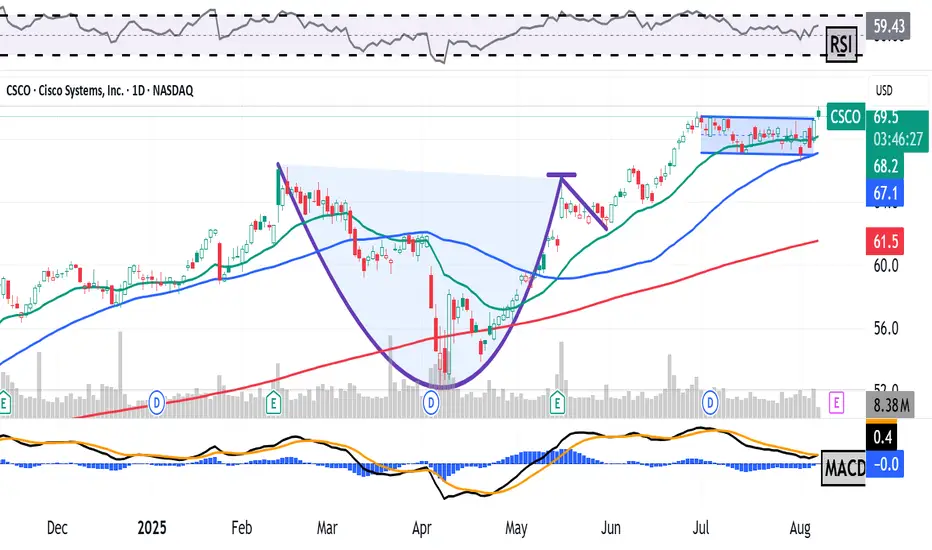
The stock has basically gone sideways since then, as you can see from this 10-month chart that runs through Tuesday afternoon:

Readers will see that CSCO developed a bullish "cup with handle" pattern from early February into late May, as denoted by the purple curving line in the chart's center.
The stock then spent June breaking out of this pattern, but really only tacked on about 6% or 7% above the pattern's pivot.
After that, Cisco traded in a very narrow range from early July into the present. This is referred to as a "tight area," marked with a purple-shaded rectangle at the chart's right.
Tight areas often denote a consolidation period ahead of a violent move that could go either way. It's little surprise that CSCO went into a period like this ahead of earnings.
Meanwhile, Cisco's Relative Strength Index (the gray line at the chart's top) is neutral, but its daily Moving Average Convergence Divergence index (or "MACD," the gold and black lines and blue bars at the chart's bottom) is anything but.
Within the daily MACD, the histogram of Cisco's 9-day Exponential Moving Average (or "EMA," denoted with blue bars) has been in negative territory and for almost a full month. That's typically a bearish signal.
Also note that Cisco's 12-day EMA (the black line) has been running below the 26-day EMA (the gold line) for just about the same time period, although both lines are still above zero. That, too, is traditionally a very bearish posture.
Cisco bulls have to hope that the stock will break out above the tight area's upper trendline at about $69 a share. That wouldn't take much –- in fact, CSCO closed at $69.21 Wednesday.
However, the stock has also been straddling its 21-day EMA (the green line above) for more than three weeks now. That likely means that the swing-trade crowd is active in Cisco, which should add momentum to any catalyst that next week's earnings might provide.
Still, the worry for Cisco bulls (and the hope for CSCO bears) could involve the stock's rapidly rising 50-day Simple Moving Average, or "SMA," marked with a blue line above.
Should Cisco sink below that line ($66.90 in the chart above), many portfolio managers might feel forced to reduce their long-side exposure. Keep in mind that with the swing crowd probably all over this stock, any such move could quickly become exaggerated.
(Moomoo Technologies Inc. Markets Commentator Stephen “Sarge” Guilfoyle was long CSCO at the time of writing this column.)
This article discusses technical analysis, other approaches, including fundamental analysis, may offer very different views. The examples provided are for illustrative purposes only and are not intended to be reflective of the results you can expect to achieve. Specific security charts used are for illustrative purposes only and are not a recommendation, offer to sell, or a solicitation of an offer to buy any security. Past investment performance does not indicate or guarantee future success. Returns will vary, and all investments carry risks, including loss of principal. This content is also not a research report and is not intended to serve as the basis for any investment decision. The information contained in this article does not purport to be a complete description of the securities, markets, or developments referred to in this material. Moomoo and its affiliates make no representation or warranty as to the article's adequacy, completeness, accuracy or timeliness for any particular purpose of the above content. Furthermore, there is no guarantee that any statements, estimates, price targets, opinions or forecasts provided herein will prove to be correct.
Moomoo is a financial information and trading app offered by Moomoo Technologies Inc. In the U.S., investment products and services on Moomoo are offered by Moomoo Financial Inc., Member FINRA/SIPC.
TradingView is an independent third party not affiliated with Moomoo Financial Inc., Moomoo Technologies Inc., or its affiliates. Moomoo Financial Inc. and its affiliates do not endorse, represent or warrant the completeness and accuracy of the data and information available on the TradingView platform and are not responsible for any services provided by the third-party platform.
Let's check things out:
Cisco's Fundamental Analysis
Cisco plans to unveil earnings after the bell on Wednesday (Aug. 13), with the Street looking for $0.98 in adjusted earnings per share on $14.6 billion of revenue.
That would represent a 12.6% gain on the $0.87 in adjusted EPS that CSCO reported in the year-ago period, as well as about 7% growth from Q4 2024's $13.6 billion in revenue.
Of the 19 analysts that I found that cover CSCO, 16 have increased their earnings estimates since the latest quarter began, while just one has revised their estimate lower. (Two kept their estimates unchanged.)
Cisco has enjoyed several seemingly positive catalysts recently. Just last week, J.P. Morgan's Samik Chatterjee reiterated his "Buy" rating on CSCO while raising the stock's target price to $78 from a previous $67.
Matthew Nikham of Deutsche Bank also recently upgraded Cisco to a "Buy" from a "Hold," while boosting his price target to $73 from $65.
And last month, Bank of America included the stock in its top 10 ideas for the third quarter – interestingly, a list that wasn't crowded with tech stocks.
There were none of the "usual suspects" on the list -- no "Magnificent Seven" names and no elite GPU designers. Cisco and Datadog (DOGG) were the only tech stocks that I saw.
Cisco's Fundamental Analysis
Ironically, Cisco had been rallying from early April right up until the point where the analyst community seemed to jump on the bandwagon.
The stock has basically gone sideways since then, as you can see from this 10-month chart that runs through Tuesday afternoon:
Readers will see that CSCO developed a bullish "cup with handle" pattern from early February into late May, as denoted by the purple curving line in the chart's center.
The stock then spent June breaking out of this pattern, but really only tacked on about 6% or 7% above the pattern's pivot.
After that, Cisco traded in a very narrow range from early July into the present. This is referred to as a "tight area," marked with a purple-shaded rectangle at the chart's right.
Tight areas often denote a consolidation period ahead of a violent move that could go either way. It's little surprise that CSCO went into a period like this ahead of earnings.
Meanwhile, Cisco's Relative Strength Index (the gray line at the chart's top) is neutral, but its daily Moving Average Convergence Divergence index (or "MACD," the gold and black lines and blue bars at the chart's bottom) is anything but.
Within the daily MACD, the histogram of Cisco's 9-day Exponential Moving Average (or "EMA," denoted with blue bars) has been in negative territory and for almost a full month. That's typically a bearish signal.
Also note that Cisco's 12-day EMA (the black line) has been running below the 26-day EMA (the gold line) for just about the same time period, although both lines are still above zero. That, too, is traditionally a very bearish posture.
Cisco bulls have to hope that the stock will break out above the tight area's upper trendline at about $69 a share. That wouldn't take much –- in fact, CSCO closed at $69.21 Wednesday.
However, the stock has also been straddling its 21-day EMA (the green line above) for more than three weeks now. That likely means that the swing-trade crowd is active in Cisco, which should add momentum to any catalyst that next week's earnings might provide.
Still, the worry for Cisco bulls (and the hope for CSCO bears) could involve the stock's rapidly rising 50-day Simple Moving Average, or "SMA," marked with a blue line above.
Should Cisco sink below that line ($66.90 in the chart above), many portfolio managers might feel forced to reduce their long-side exposure. Keep in mind that with the swing crowd probably all over this stock, any such move could quickly become exaggerated.
(Moomoo Technologies Inc. Markets Commentator Stephen “Sarge” Guilfoyle was long CSCO at the time of writing this column.)
This article discusses technical analysis, other approaches, including fundamental analysis, may offer very different views. The examples provided are for illustrative purposes only and are not intended to be reflective of the results you can expect to achieve. Specific security charts used are for illustrative purposes only and are not a recommendation, offer to sell, or a solicitation of an offer to buy any security. Past investment performance does not indicate or guarantee future success. Returns will vary, and all investments carry risks, including loss of principal. This content is also not a research report and is not intended to serve as the basis for any investment decision. The information contained in this article does not purport to be a complete description of the securities, markets, or developments referred to in this material. Moomoo and its affiliates make no representation or warranty as to the article's adequacy, completeness, accuracy or timeliness for any particular purpose of the above content. Furthermore, there is no guarantee that any statements, estimates, price targets, opinions or forecasts provided herein will prove to be correct.
Moomoo is a financial information and trading app offered by Moomoo Technologies Inc. In the U.S., investment products and services on Moomoo are offered by Moomoo Financial Inc., Member FINRA/SIPC.
TradingView is an independent third party not affiliated with Moomoo Financial Inc., Moomoo Technologies Inc., or its affiliates. Moomoo Financial Inc. and its affiliates do not endorse, represent or warrant the completeness and accuracy of the data and information available on the TradingView platform and are not responsible for any services provided by the third-party platform.
Disclaimer
The information and publications are not meant to be, and do not constitute, financial, investment, trading, or other types of advice or recommendations supplied or endorsed by TradingView. Read more in the Terms of Use.
Disclaimer
The information and publications are not meant to be, and do not constitute, financial, investment, trading, or other types of advice or recommendations supplied or endorsed by TradingView. Read more in the Terms of Use.