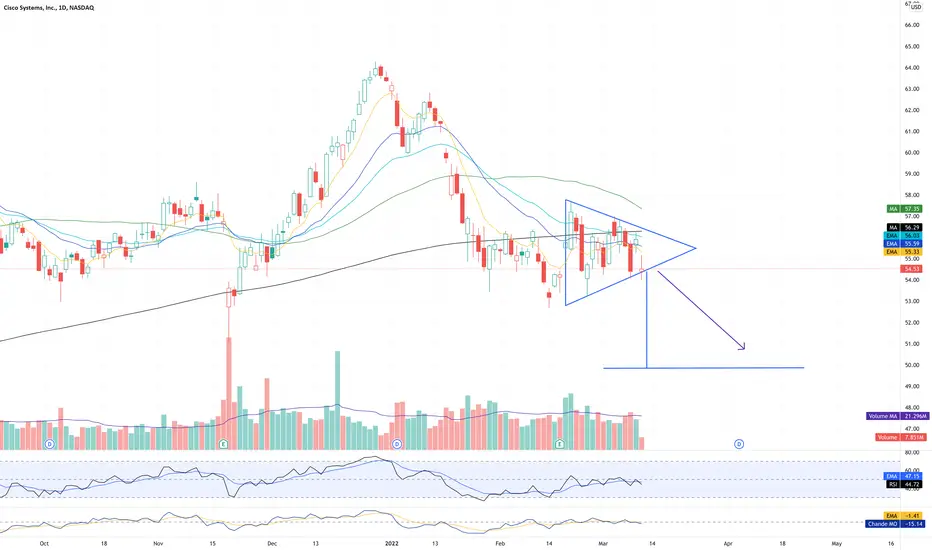
A symmetrical triangle pattern appears on the daily and intraday charts. Generally, price activity within this pattern should contract as price forms lower highs and higher lows. Symmetrical triangle patterns do not suggest a breakout direction, so other technical evidence must be considered.
In this case, CSCO is snug against the lower trendline of the pattern. While this is an uptrendline, the upper trendline converging downward reveals that the pattern is contracting / consolidative.
Momentum indicators shown include RSI and the Chande momentum oscillator. Both are bearish. RSI has struggled to make any progress above the 50 level. And Chande as of March 10 is below the zero level and sloped downward.
CSCO is trading below its 200 SMA, 21 EMA, 34 EMA, and 50 SMA on the daily chart. And those moving averages are sloped and stacked in a bearish direction.
A reasonable target might be around 49-50 over the coming weeks (perhaps as soon as days if the general indices experience another flush). To derive this target, project downward the maximum depth of the pattern from the anticipated breakout point. This leads to a downside target of 49-51 depending on the day the breakout occurs.
Caveat: if the markets and SOX index start to recover decisively, consider an upside breakout a possibility, with a similar projected target near 60. But given the technicals, the probability of an upside breakout seems low.
SquishTrade
Disclaimer
The information and publications are not meant to be, and do not constitute, financial, investment, trading, or other types of advice or recommendations supplied or endorsed by TradingView. Read more in the Terms of Use.
SquishTrade
Disclaimer
The information and publications are not meant to be, and do not constitute, financial, investment, trading, or other types of advice or recommendations supplied or endorsed by TradingView. Read more in the Terms of Use.