CTCUSDT 1D Chart Analysis | Ascending Momentum Targets Major Breakout
🔍 Let’s break down CTC/USDT spot price action and map out the upward scenario as bullish momentum gains traction, with a focus on trendline support, volume dynamics, and key resistance levels.
⏳ 1-Day Overview
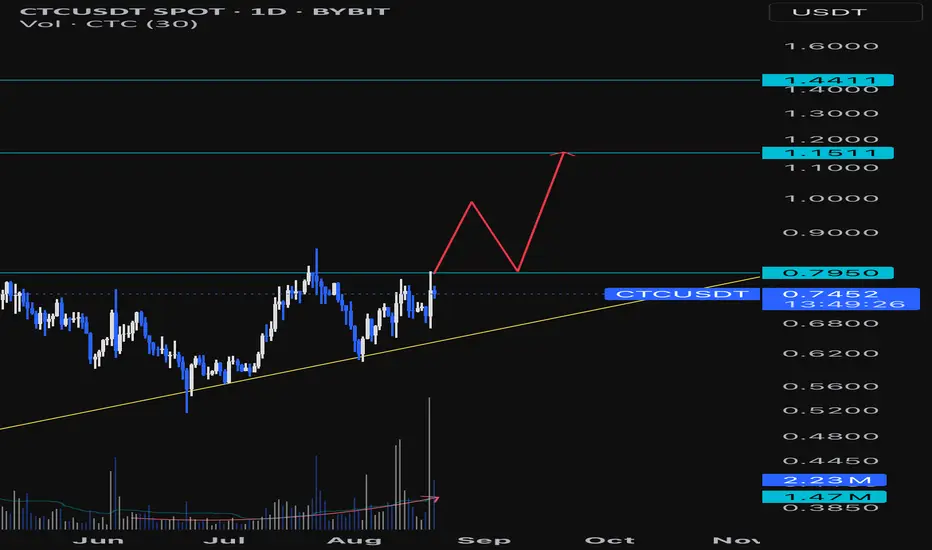
CTC/USDT on the daily chart is carving out an ascending triangle formation, supported by a firm rising yellow trendline. Price is pressing against key horizontal resistance at $0.7950 as trading volume builds, hinting at buying interest ahead of a breakout move.
📈 Volume & Structure Insights
- Steady volume expansion as price approaches the apex, confirming accumulation and bullish intent.
- Strong base forming above the yellow ascending trendline, which has consistently held since April.
- Immediate upside resistance stands at $0.7950; higher levels to target are $1.1511 and $1.4411 on a convincing breakout.
📊 Key Highlights:
- Technical structure: Clear ascending triangle signals bullish continuation if resistance cracks.
- Volume spike: Increasing volume supports the validity of the upward move.
- Breakout scenario: If price closes above $0.7950, expect momentum to carry toward $1.1511 (next resistance), followed by $1.4411.
- Price projection: Short-term retests are likely (see mapped path), but trend bias favors upside as long as the rising support holds.
🚨 Conclusion:
CTC/USDT is poised for a breakout, with momentum and volume aligning for an upward move. Watch for a daily close above $0.7950 as the trigger—targets are $1.1511 and $1.4411. Volume acceleration and bullish structure reinforce the setup. Stay alert for invalidation if the ascending trendline fails to hold.
🔍 Let’s break down CTC/USDT spot price action and map out the upward scenario as bullish momentum gains traction, with a focus on trendline support, volume dynamics, and key resistance levels.
⏳ 1-Day Overview
CTC/USDT on the daily chart is carving out an ascending triangle formation, supported by a firm rising yellow trendline. Price is pressing against key horizontal resistance at $0.7950 as trading volume builds, hinting at buying interest ahead of a breakout move.
📈 Volume & Structure Insights
- Steady volume expansion as price approaches the apex, confirming accumulation and bullish intent.
- Strong base forming above the yellow ascending trendline, which has consistently held since April.
- Immediate upside resistance stands at $0.7950; higher levels to target are $1.1511 and $1.4411 on a convincing breakout.
📊 Key Highlights:
- Technical structure: Clear ascending triangle signals bullish continuation if resistance cracks.
- Volume spike: Increasing volume supports the validity of the upward move.
- Breakout scenario: If price closes above $0.7950, expect momentum to carry toward $1.1511 (next resistance), followed by $1.4411.
- Price projection: Short-term retests are likely (see mapped path), but trend bias favors upside as long as the rising support holds.
🚨 Conclusion:
CTC/USDT is poised for a breakout, with momentum and volume aligning for an upward move. Watch for a daily close above $0.7950 as the trigger—targets are $1.1511 and $1.4411. Volume acceleration and bullish structure reinforce the setup. Stay alert for invalidation if the ascending trendline fails to hold.
Disclaimer
The information and publications are not meant to be, and do not constitute, financial, investment, trading, or other types of advice or recommendations supplied or endorsed by TradingView. Read more in the Terms of Use.
Disclaimer
The information and publications are not meant to be, and do not constitute, financial, investment, trading, or other types of advice or recommendations supplied or endorsed by TradingView. Read more in the Terms of Use.