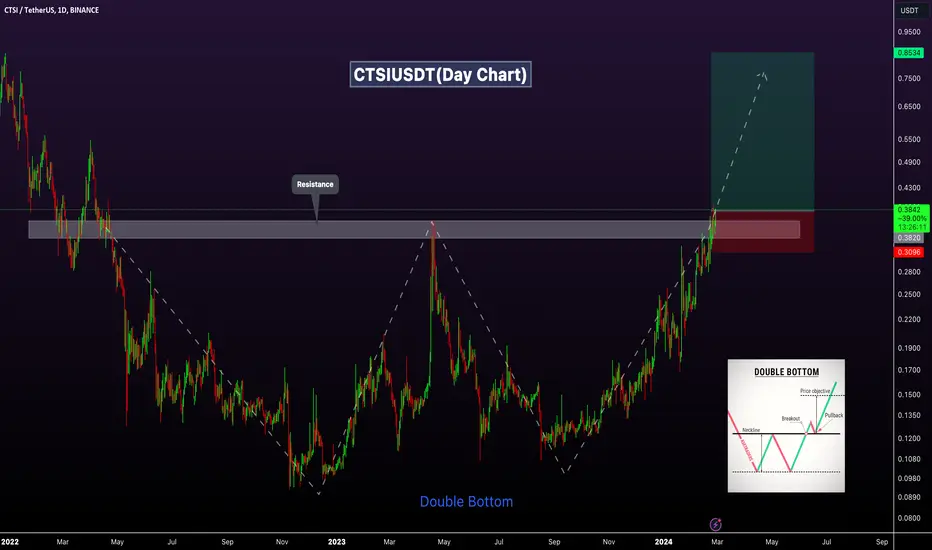
CTSIUSDT Technical analysis update
CTSI price recently exceeded the neckline of a double bottom pattern on the day chart, accompanied by high volume, after a 675 days of consolidation this TA analysis indicate the bullish move.
Regards
Hexa
CTSI price recently exceeded the neckline of a double bottom pattern on the day chart, accompanied by high volume, after a 675 days of consolidation this TA analysis indicate the bullish move.
Regards
Hexa
Note
CTSIUSDT 20%+ gain🚀Telegram : t.me/hexatrades
🌐Website: hexatrades.io/
🗣️Twitter(X): twitter.com/HexaTrades
🌐Website: hexatrades.io/
🗣️Twitter(X): twitter.com/HexaTrades
Related publications
Disclaimer
The information and publications are not meant to be, and do not constitute, financial, investment, trading, or other types of advice or recommendations supplied or endorsed by TradingView. Read more in the Terms of Use.
🚀Telegram : t.me/hexatrades
🌐Website: hexatrades.io/
🗣️Twitter(X): twitter.com/HexaTrades
🌐Website: hexatrades.io/
🗣️Twitter(X): twitter.com/HexaTrades
Related publications
Disclaimer
The information and publications are not meant to be, and do not constitute, financial, investment, trading, or other types of advice or recommendations supplied or endorsed by TradingView. Read more in the Terms of Use.