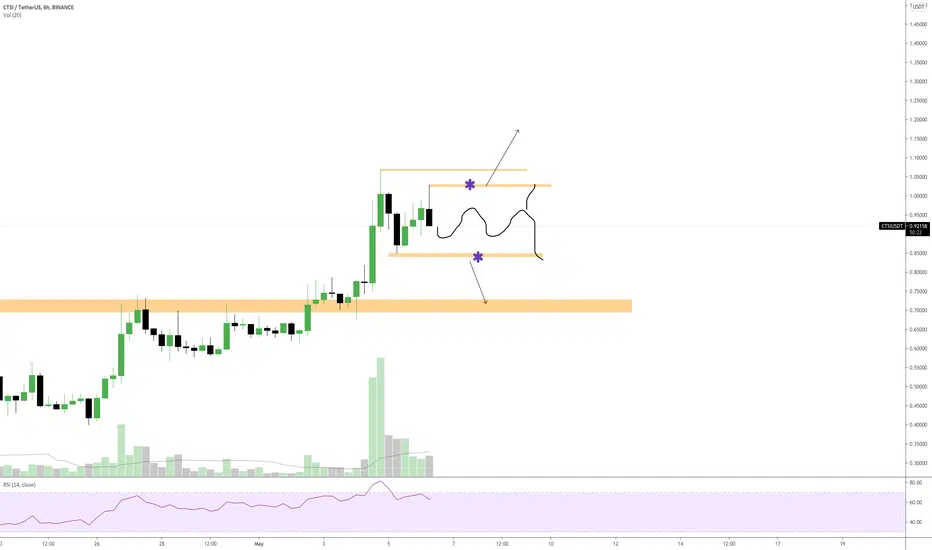
After the huge breakout we saw on CTSI we are now consolidating a bit and the most likely scenario is that we now are creating a tight range.
What you see is the 6 H chart but if you zoom out to the daily chart we can still have a bullflag.
If we break the lows then i think we drop back to the breakout zone, if we break the highs then the bullflag is confirmed.
For every new follower i will add a new idea :)
What you see is the 6 H chart but if you zoom out to the daily chart we can still have a bullflag.
If we break the lows then i think we drop back to the breakout zone, if we break the highs then the bullflag is confirmed.
For every new follower i will add a new idea :)
CHECK IT OUT 😎
⬇️⬇️⬇️
youtube.com/channel/UC_UP6XvTaTEKIapdM-aKzWA
twitter.com/TheChartingArt
⬇️⬇️⬇️
youtube.com/channel/UC_UP6XvTaTEKIapdM-aKzWA
twitter.com/TheChartingArt
Disclaimer
The information and publications are not meant to be, and do not constitute, financial, investment, trading, or other types of advice or recommendations supplied or endorsed by TradingView. Read more in the Terms of Use.
Disclaimer
The information and publications are not meant to be, and do not constitute, financial, investment, trading, or other types of advice or recommendations supplied or endorsed by TradingView. Read more in the Terms of Use.