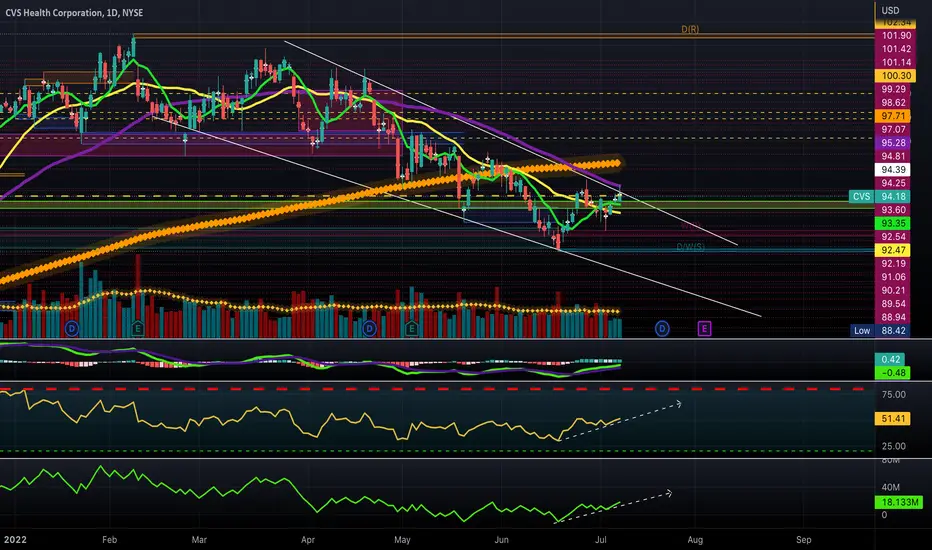
The "Decending Channel" pattern was identified on the weekly chart.
A "Double Bottom" pattern was identified on the daily timeframe, however, price failed to go higher. A closer look at recent price action and we have confirmation of resistance becoming support (see level 93.62). Though this is true, it is best to wait for a break of structure before placing a trade to the upside.
On a final note, the 21 MA crossed up the 9MA on Friday, July 8, 2022. Also, the RSI and volume indicator made higher lows and higher highs on the same timeframe.
Personally, I will enter a swing position lightly at the break of the trendline. I will also consider a secondary play action to include a break above 95 or 96.
Thanks for reading,
MrALtrades00
Note
According to Finviz, Yahoo Financial, TD Ameritrade and Morning Star, the short float % is 1.15.Disclaimer
The information and publications are not meant to be, and do not constitute, financial, investment, trading, or other types of advice or recommendations supplied or endorsed by TradingView. Read more in the Terms of Use.
Disclaimer
The information and publications are not meant to be, and do not constitute, financial, investment, trading, or other types of advice or recommendations supplied or endorsed by TradingView. Read more in the Terms of Use.