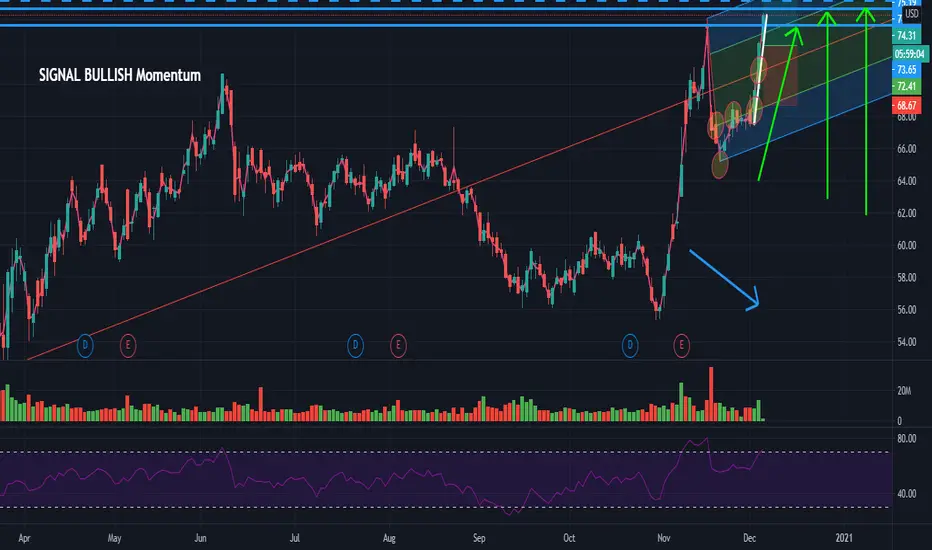
Hey people, CVS HEALTH CORPORATION is in bullish momentum with a large hammer candle and abnormal acht volume. In the TIMEFRAME M1 we see a marubozu with a large volume of purchases issued, it is in the middle of a range test. Great possibility of breaking out the price and at the same time arranging it to arrive in the one above and go to the next higher. With several high notably (on TIMEFRAME H4) upstream and an excess (on TIMEFRAME H1) Before we start breaking the intermediate median of ANDREWS PICHTFORK. And if the buyers are still in the process, reach the second high verifacation (on the TIMEFRAME H4) with an excess on the TIMEFRAME H1. Little force to arrive at half of the intermediate median of the fork ANDREWS PICHTFORK
Please LIKE & FOLLOW, thank you!
Please LIKE & FOLLOW, thank you!
Disclaimer
The information and publications are not meant to be, and do not constitute, financial, investment, trading, or other types of advice or recommendations supplied or endorsed by TradingView. Read more in the Terms of Use.
Disclaimer
The information and publications are not meant to be, and do not constitute, financial, investment, trading, or other types of advice or recommendations supplied or endorsed by TradingView. Read more in the Terms of Use.