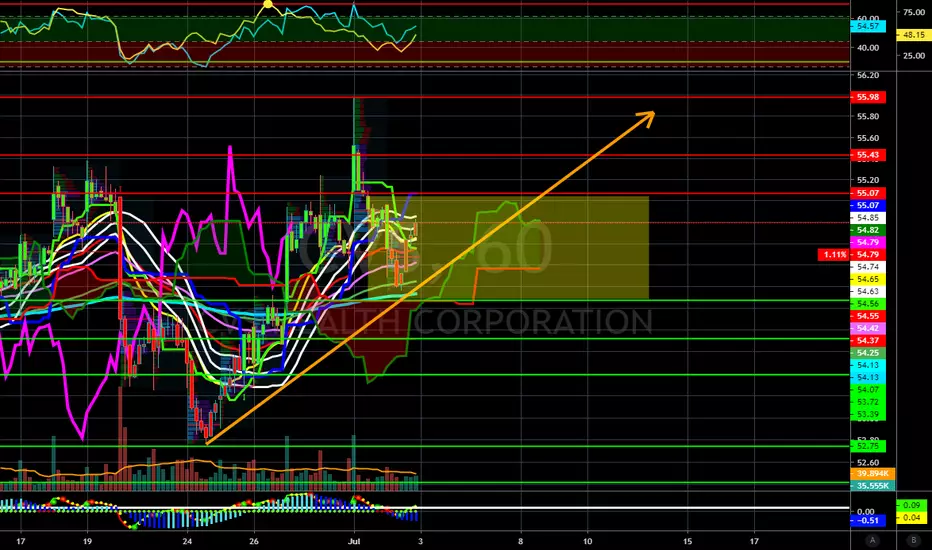
Hi my charts are complex but to help you understand it i will start by telling you that the green lines are levels of support..The red lines are levels of resistance and the orange line is the overal trend..Remember the trend is your friend. The yellow rectangle is the Price tube where the price is moving sideways or breathing. I feel after this breather price will continue the trend by breaking up!!! Always remember I am by no means a financial advisor.
Disclaimer
The information and publications are not meant to be, and do not constitute, financial, investment, trading, or other types of advice or recommendations supplied or endorsed by TradingView. Read more in the Terms of Use.
Disclaimer
The information and publications are not meant to be, and do not constitute, financial, investment, trading, or other types of advice or recommendations supplied or endorsed by TradingView. Read more in the Terms of Use.