Timeline - now to 3 months
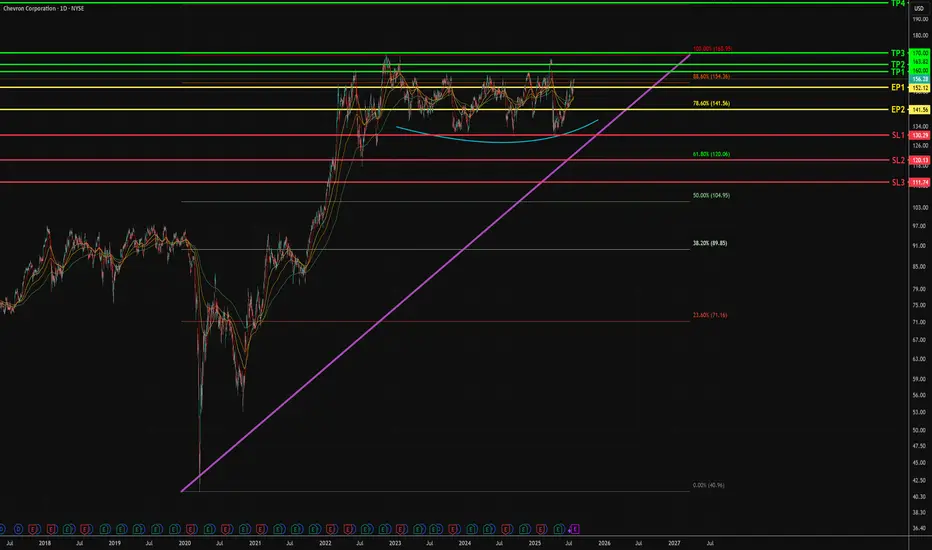
1. Bullish flag pattern sustained, form during Oct 2021.
2. Rounding bottom above 1D resistance at $130
- Last close is above Fib 88.6% - $154.36
- In the 2 days, weak selling pressure is noticed.
3. More attempts to break 88.6% Fib level opposed to $130 support line
- Bullish angle upthrust stays above 45 degrees
- Concludes high change of breaking 88.6% fib level, towards previous high of $169.66
3. Entry points
EP 1 - buy spot with 1 or 0.5 size
EP 2 - Enter another 1 or 0.5 size if closing prices stay above Fib 78.6% at $141.56
Disclaimer
The information and publications are not meant to be, and do not constitute, financial, investment, trading, or other types of advice or recommendations supplied or endorsed by TradingView. Read more in the Terms of Use.
Disclaimer
The information and publications are not meant to be, and do not constitute, financial, investment, trading, or other types of advice or recommendations supplied or endorsed by TradingView. Read more in the Terms of Use.