🔻 :
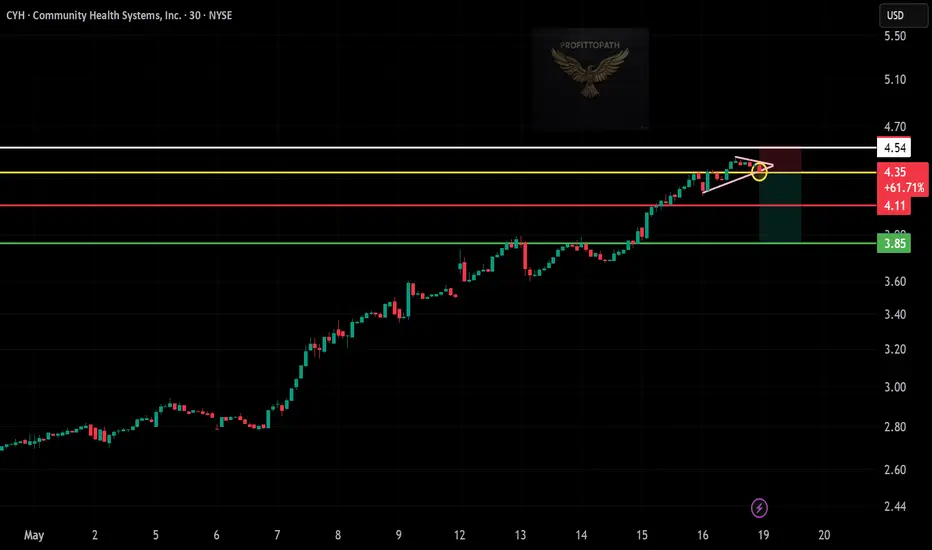
Trade Type: Short
Ticker: CYH
Timeframe: 30-Min Chart
Pattern: Rising wedge breakdown (bearish reversal)
📉 Entry Point:
Around $4.35
Breakdown confirmed from the rising wedge pattern (marked with yellow circle)
🔒 Stop-Loss:
Above $4.54
Just above recent highs and wedge invalidation zone
🎯 Take Profit Targets:
TP1: $4.11 (first support zone)
TP2: $3.85 (strong horizontal support zone)
⚖️ Risk-Reward Ratio:
Risk: ~$0.19
Reward: ~$0.50
R:R ≈ 2.6:1 (solid short opportunity)
🔎 Technical Highlights:
Price lost momentum near resistance
Rising wedge breakdown signals possible trend reversal
Volume fading at highs – bearish confirmation
Disclaimer
The information and publications are not meant to be, and do not constitute, financial, investment, trading, or other types of advice or recommendations supplied or endorsed by TradingView. Read more in the Terms of Use.
Disclaimer
The information and publications are not meant to be, and do not constitute, financial, investment, trading, or other types of advice or recommendations supplied or endorsed by TradingView. Read more in the Terms of Use.