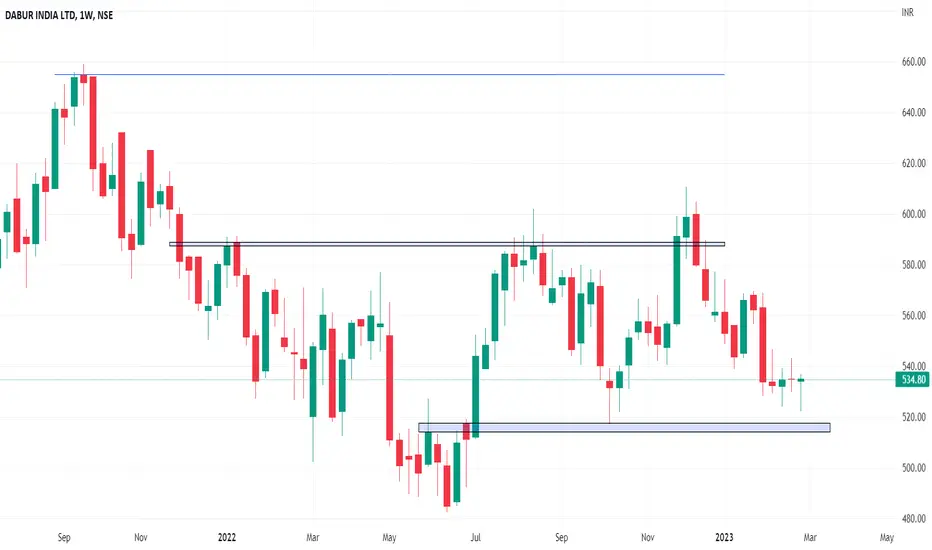
In the Weekly Chart of DABUR ,
we can see that, it has done consolidation at near by Previous Breakout Level.
Also, Bullish Hammer Candle has been formed.
If you enter DABUR, Go Long.
we can see that, it has done consolidation at near by Previous Breakout Level.
Also, Bullish Hammer Candle has been formed.
If you enter DABUR, Go Long.
Disclaimer
The information and publications are not meant to be, and do not constitute, financial, investment, trading, or other types of advice or recommendations supplied or endorsed by TradingView. Read more in the Terms of Use.
Disclaimer
The information and publications are not meant to be, and do not constitute, financial, investment, trading, or other types of advice or recommendations supplied or endorsed by TradingView. Read more in the Terms of Use.