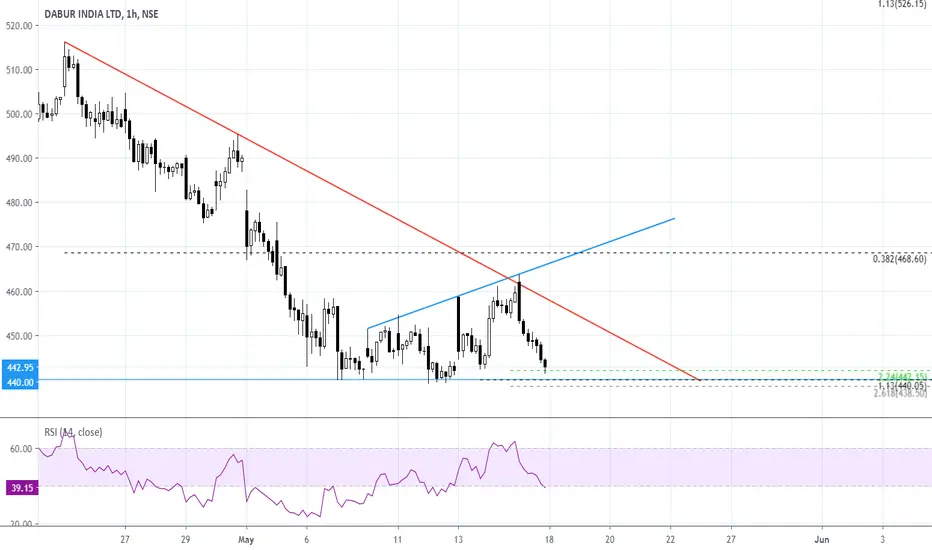
Stock can be seen holding 438-440 support from last 6 trading sessions.
Prices can be seen trading in a Broadening triangle pattern.
Divergence in RSI can also be clearly seen.
Prices can be seen trading in a Broadening triangle pattern.
Divergence in RSI can also be clearly seen.
Disclaimer
The information and publications are not meant to be, and do not constitute, financial, investment, trading, or other types of advice or recommendations supplied or endorsed by TradingView. Read more in the Terms of Use.
Disclaimer
The information and publications are not meant to be, and do not constitute, financial, investment, trading, or other types of advice or recommendations supplied or endorsed by TradingView. Read more in the Terms of Use.
