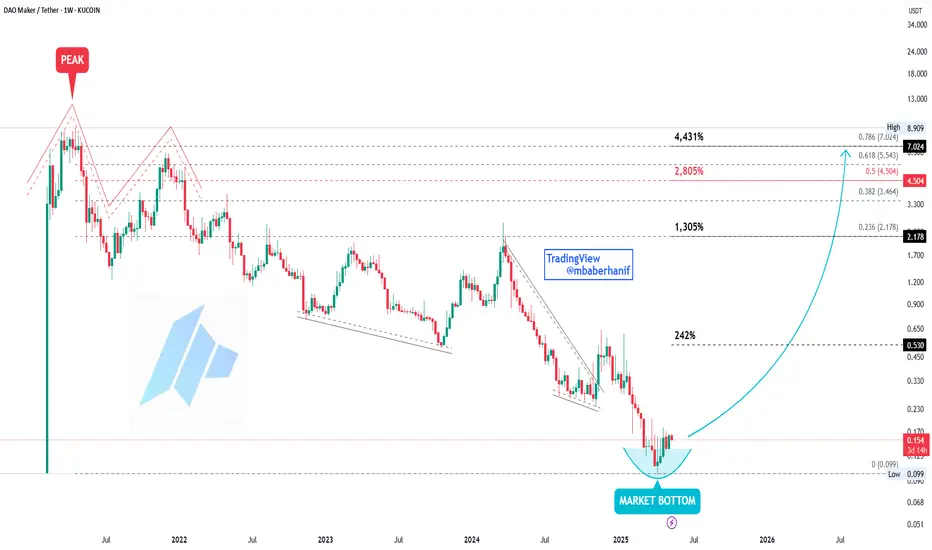
Here we have a clear and technically significant bottom on the DAO/USDT chart—a true rounded bottom structure that signals the end of a prolonged bear cycle and the potential beginning of a strong bullish trend.
This bottom is "perfect" in its structure: It follows a textbook pattern. Initially, we see some bullish action—an impulse wave that sets the stage. What follows is a sharp decline, broken up by a period of consolidation—a rest phase that is characteristic of major downtrends. Then comes the final leg down, culminating in a new All-Time Low at $0.099. From this point, DAO begins to round out, forming a clean and smooth bottoming curve that marks a clear shift in market sentiment.
The rounded bottom not only indicates exhaustion of selling pressure but also a potential accumulation phase. DAO is now trading at deeply discounted levels compared to previous market phases—still below historical price levels from early and mid-2023. The current price action is only revisiting the first minor bounce zone seen back in late 2023, which reinforces the idea that this is truly a bottomed-out asset.
The structure suggests that the recovery will gain traction and transition into a full-fledged bull market. The chart outlines clear Fibonacci-based targets, ranging from modest gains of 242% to a massive 4,431%, with potential for even more if momentum carries DAO to new highs. These targets are conservative when viewed in the context of historical cycles. Even the mid-range target of $4.50 already presents a 10X opportunity from current levels, indicating massive growth potential for the long-term investor or strategic trader.

On the daily timeframe, DAO/USDT is presenting a bullish reversal pattern in the form of an Inverse Head and Shoulders, further validating the broader rounded bottom structure seen on the weekly chart. This is a classic technical signal that often precedes a significant trend reversal, especially after a prolonged downtrend like the one DAO has experienced.
The pattern is well-defined:
The Left Shoulder formed in early March 2025 after an aggressive selloff.
This was followed by a deeper low—the Head—which printed the current All-Time Low near $0.099 in late March.
The Right Shoulder developed in late April to early May, holding a higher low and indicating waning bearish momentum.
What makes this setup compelling is that the neckline—around the $0.175–$0.18 region—is being tested. A successful breakout above this resistance would confirm the pattern and potentially trigger a strong bullish move. The height of the pattern projects a measured move toward the $0.26–$0.28 range initially, with further continuation aligning with weekly targets beyond $0.50.
This inverse head and shoulders, nested within the larger rounded bottom on the weekly chart, provides a powerful confluence of bullish signals. DAO/USDT appears to be transitioning from accumulation to the beginning of a possible trend reversal. If confirmed with volume and momentum, the breakout could mark the start of a sustained bullish phase.
This bottom is "perfect" in its structure: It follows a textbook pattern. Initially, we see some bullish action—an impulse wave that sets the stage. What follows is a sharp decline, broken up by a period of consolidation—a rest phase that is characteristic of major downtrends. Then comes the final leg down, culminating in a new All-Time Low at $0.099. From this point, DAO begins to round out, forming a clean and smooth bottoming curve that marks a clear shift in market sentiment.
The rounded bottom not only indicates exhaustion of selling pressure but also a potential accumulation phase. DAO is now trading at deeply discounted levels compared to previous market phases—still below historical price levels from early and mid-2023. The current price action is only revisiting the first minor bounce zone seen back in late 2023, which reinforces the idea that this is truly a bottomed-out asset.
The structure suggests that the recovery will gain traction and transition into a full-fledged bull market. The chart outlines clear Fibonacci-based targets, ranging from modest gains of 242% to a massive 4,431%, with potential for even more if momentum carries DAO to new highs. These targets are conservative when viewed in the context of historical cycles. Even the mid-range target of $4.50 already presents a 10X opportunity from current levels, indicating massive growth potential for the long-term investor or strategic trader.
On the daily timeframe, DAO/USDT is presenting a bullish reversal pattern in the form of an Inverse Head and Shoulders, further validating the broader rounded bottom structure seen on the weekly chart. This is a classic technical signal that often precedes a significant trend reversal, especially after a prolonged downtrend like the one DAO has experienced.
The pattern is well-defined:
The Left Shoulder formed in early March 2025 after an aggressive selloff.
This was followed by a deeper low—the Head—which printed the current All-Time Low near $0.099 in late March.
The Right Shoulder developed in late April to early May, holding a higher low and indicating waning bearish momentum.
What makes this setup compelling is that the neckline—around the $0.175–$0.18 region—is being tested. A successful breakout above this resistance would confirm the pattern and potentially trigger a strong bullish move. The height of the pattern projects a measured move toward the $0.26–$0.28 range initially, with further continuation aligning with weekly targets beyond $0.50.
This inverse head and shoulders, nested within the larger rounded bottom on the weekly chart, provides a powerful confluence of bullish signals. DAO/USDT appears to be transitioning from accumulation to the beginning of a possible trend reversal. If confirmed with volume and momentum, the breakout could mark the start of a sustained bullish phase.
Disclaimer
The information and publications are not meant to be, and do not constitute, financial, investment, trading, or other types of advice or recommendations supplied or endorsed by TradingView. Read more in the Terms of Use.
Disclaimer
The information and publications are not meant to be, and do not constitute, financial, investment, trading, or other types of advice or recommendations supplied or endorsed by TradingView. Read more in the Terms of Use.