Even though the rate of DASH has increased by 0.5% over the day, the general picture remains bearish.
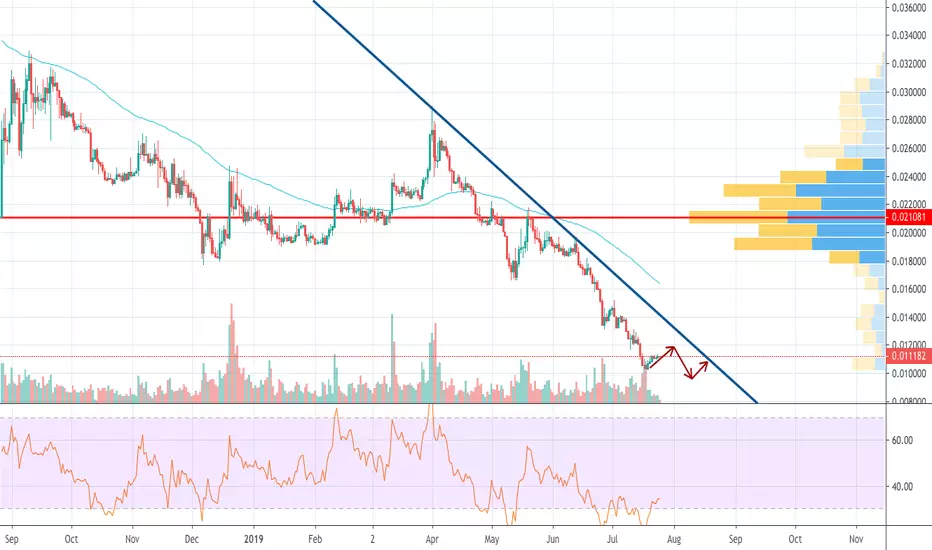
According to the chart, DASH has been declining since April 1, and there are no signals of a possible reversal. The RSI indicator is located near the oversold area, however, DASH is going to strike neither in the short no in the long-term scenario. Overall, the price is likely to fluctuate with a further drop to the area of 0.01 BTC.
According to the chart, DASH has been declining since April 1, and there are no signals of a possible reversal. The RSI indicator is located near the oversold area, however, DASH is going to strike neither in the short no in the long-term scenario. Overall, the price is likely to fluctuate with a further drop to the area of 0.01 BTC.
Disclaimer
The information and publications are not meant to be, and do not constitute, financial, investment, trading, or other types of advice or recommendations supplied or endorsed by TradingView. Read more in the Terms of Use.
Disclaimer
The information and publications are not meant to be, and do not constitute, financial, investment, trading, or other types of advice or recommendations supplied or endorsed by TradingView. Read more in the Terms of Use.