details on chart
Note
held up better than many alts...Note
moving a bit of ltc profit to this
failed breakdown on the fractal. good luck.
Note
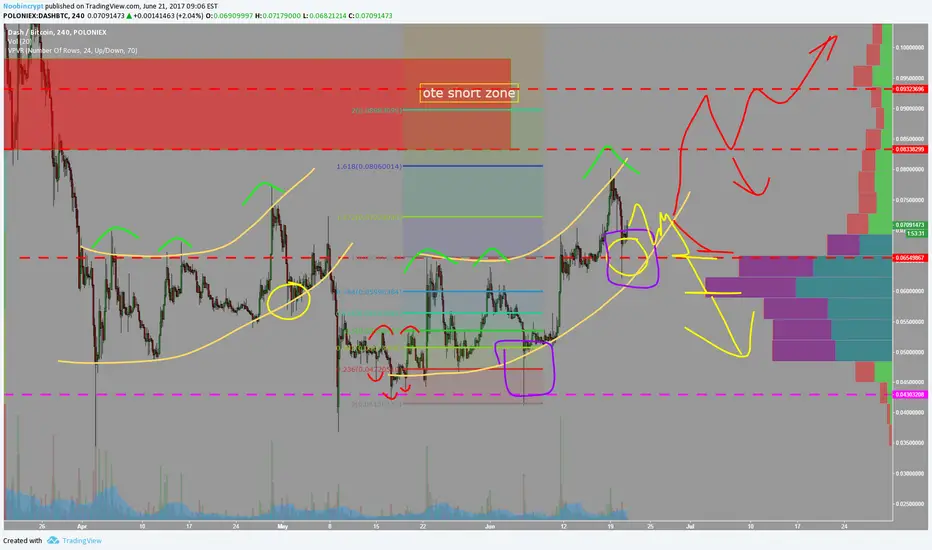
for anyone who was wondering, and i have no idea how they cant see it. the above was a simple fractal (messy and colorful on purpose). Not breaking down like before. That means it is possible for a "this time its different" scenario. We just rose from my general buy area around 0.066. Lets see what happens from here.
Note
imo anything around .029-38 is a buy as investor to offload at each of the horz levels above, these levels played out over the last while, they should continue to. markets are cyclic. it is possible we break down and have to make new levels for this chart, but i do not believe that will occur. if under 034 slow bleed we could dip into previous chart bubble zone breakout around 024.
Disclaimer
The information and publications are not meant to be, and do not constitute, financial, investment, trading, or other types of advice or recommendations supplied or endorsed by TradingView. Read more in the Terms of Use.
Disclaimer
The information and publications are not meant to be, and do not constitute, financial, investment, trading, or other types of advice or recommendations supplied or endorsed by TradingView. Read more in the Terms of Use.