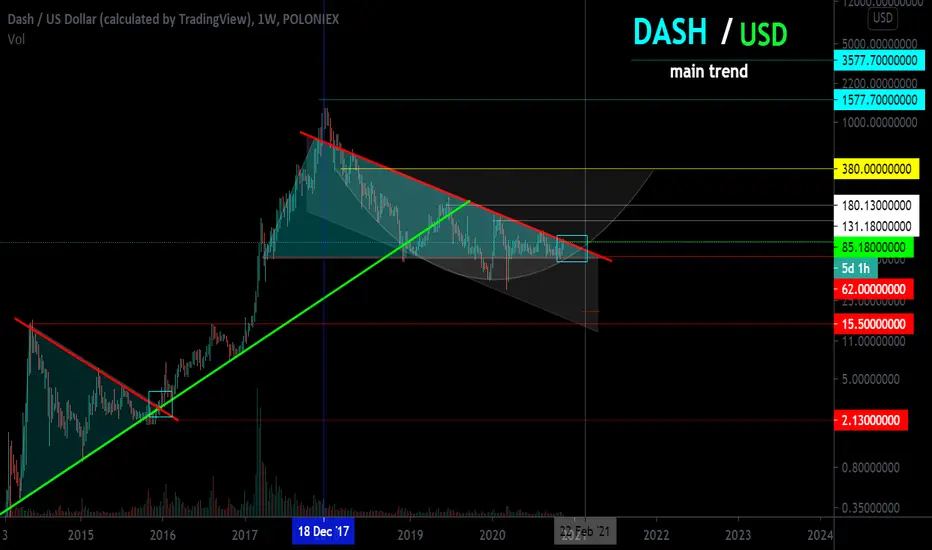
This chart shows the main trend of this cryptocurrency. Term 1 week. The idea is to understand where the price is on a global scale and what to expect. It is advisable to trade on a lower timeframe, but a large timeframe gives you an idea of what to expect in the future.
Pay attention to what formations have formed on the chart and how they can "flow" into each other, depending on how the situation develops in the reversal zones. Now the price is in the reversal zone below the line of the secondary downtrend. Which trend will dominate in the near future depends on this zone.
If a breakout occurs and the price consolidates above the resistance of the secondary trend (the resistance of the triangle) - a complete reversal and the emergence of a new upward secondary trend. If the price fails to break through and gain a foothold above this zone, it may roll back inside the triangle to support - the next reversal zone, and this is the level of 62.22. Next, you need to see how this support will react.
Note
Note
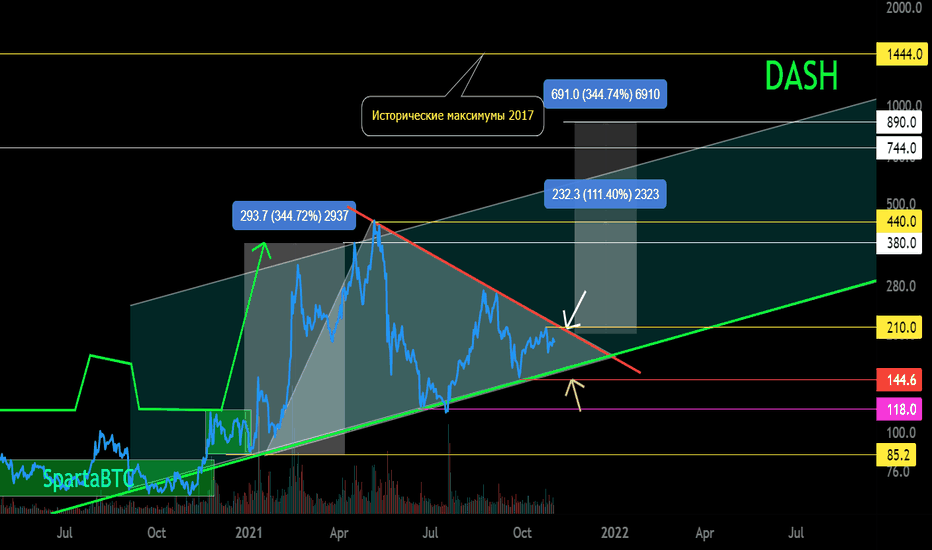
After a rollback to the breakout line, the price rise again at +111. Now there is a pullback to the breakout zone again
Note
Note
Note
Note
Note
Note
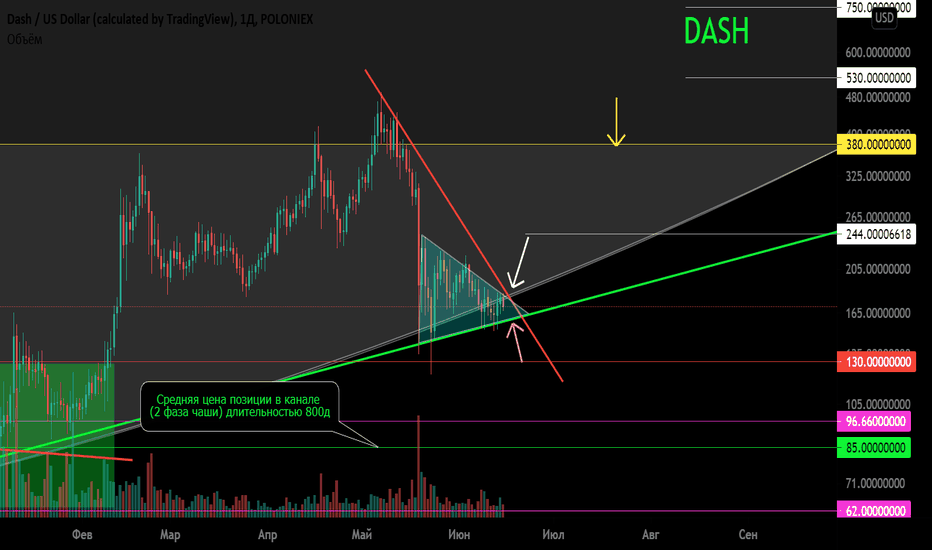
Let me remind you, in the global in the main trend a large cup was formed (with a trend reversal of more than +450%), since the end of May a pullback (secondary trend). If this local impulse and the subsequent trend reversal, a "cup with a handle" will form (although this pullback is quite significant). If the price cannot fix above $150 and then $200 - the downtrend will continue.
Translated with DeepL.com/Translator (free version)
Note
Note
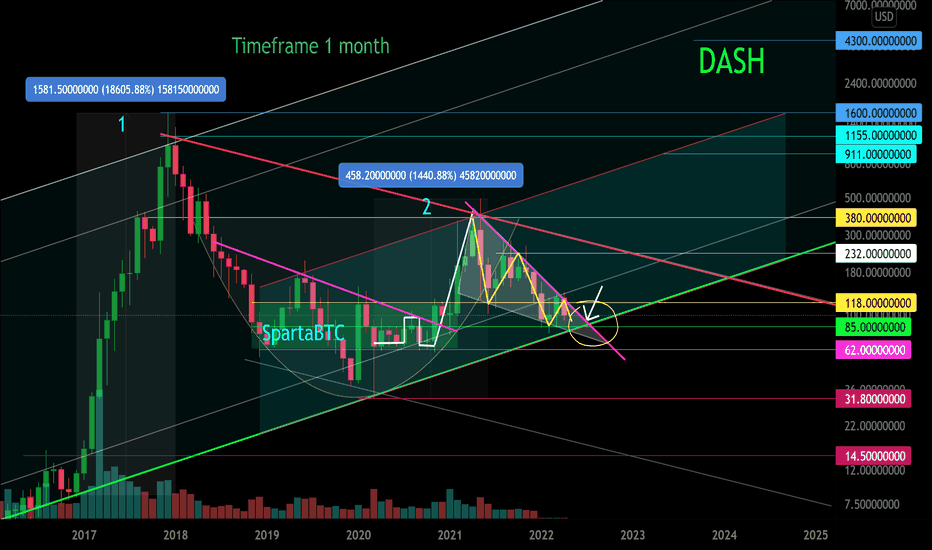
At the moment, a descending wedge has formed in the secondary trend. The price is near a potential reversal zone.
The idea on such a timeframe is to understand the main trend of this cryptocurrency and where the secondary trend zone is to trade.
✅ Telegram. Finance + Trading: t.me/SpartaBTC_1318
✅ Telegram. Сrypto trading only: t.me/SpartaBTC_tradingview
✅ Instagram: instagram.com/spartabtc_1318
✅ YouTube (Rus): goo.su/vpRzRa2
✅ Telegram. Сrypto trading only: t.me/SpartaBTC_tradingview
✅ Instagram: instagram.com/spartabtc_1318
✅ YouTube (Rus): goo.su/vpRzRa2
Disclaimer
The information and publications are not meant to be, and do not constitute, financial, investment, trading, or other types of advice or recommendations supplied or endorsed by TradingView. Read more in the Terms of Use.