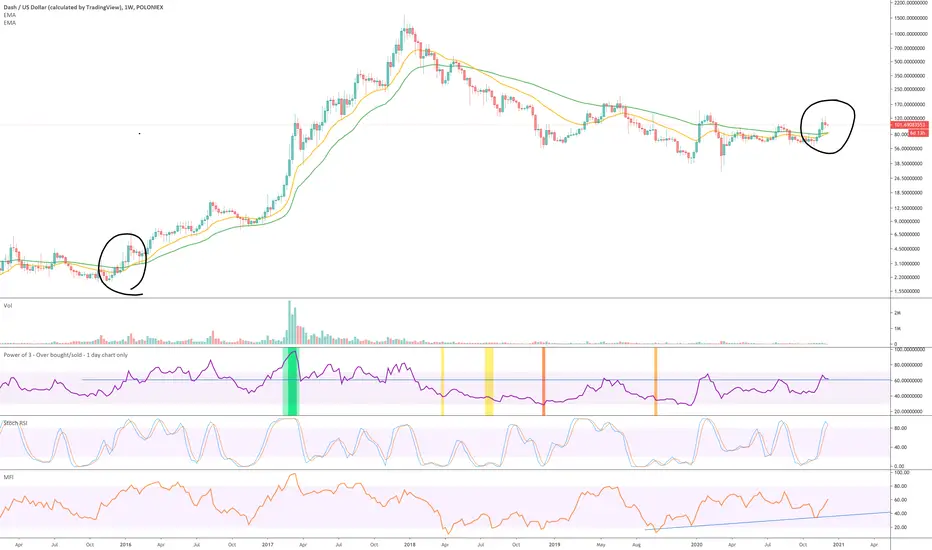
There is so much going on in the above weekly chart - where to start. Circled in black we have the 21-week (yellow) moving average crossing the 50-week moving average (green). This is very bullish, look left.
At the time of the last cross RSI was 61 - exactly where it is today! Even if you’re not a fan of fractals you have to admit RSI value at the time of the last and present cross is spooky.
Money Flow Index support (bottom oscillator - blue line) suggests the current uptrend shall continue until December 2021 at least. Do nothing until them but hold if you can. The majority of investors will be unable to hold by then and similarly over 90% will be unable to sell when the overbought condition is reached. Otherwise known as buy low sell high. Ping me below for updates as I don’t hold dash.
Note
Looks like another week is needed. Price action is on the 21-week moving average (yellow line) but Stochastic RSI is crossing downward - never buy into a downward Stochastic RSI.If you're long on Dash, a buy above $73 is good. If $73 is broken price action will likely return to $45. But I don't see that happening.
Trade active
Two very bullish signals for Dash have emerged as the week comes to a close.1) The 600-day moving average (red line) on the 1-day chart below offers strong price action support at the same time RSI resistance was broken. Very bullish.
2) Hidden bullish divergence on the 3-day chart between price action and the oscillators as price action makes a strong bounce off the 21-week moving average (green line).
A buy from $97 is good if you can get it.
1-day chart
3-day chart:
Note
Just noticed the squeezing & constriction on the Bollinger Bands - by definition it is an indication a big move is coming. If to the upside, it'll be $200, which would should happen rather quickly. If to downside, $56.Trade active
Note
It is amazing how beautifully this fractal is playing out on the 10-day chart below. Price action recently printed strong support off the 500-day moving average (blue line) and now rests on the 21-wweek (green line).Circled in orange you can see what we should expect to happen in the weeks ahead - all good!
Note
1st test point $390Trade active
A perfect Dragonfly DOJI prints on the 10-day chart. The same candle stick pattern can be observed across all major exchanges.Going out on a limb here, but I think it is safe to say this is the last time ever Dash will be at this price level once it departs.
Trade active
Trading very active ;-)A sudden move to the $500 mark should occur before the end of the month.
Note
The 2-week chart prints a new candle with a breakout from previous resistance.The next resistance after $300 is around $1168.
Trade active
On the 2-week Dash.D dominance chart a massive Dragonfly DOJI candle is printed, next to where I've written 'WOW'.What does this mean? It means fans of Dash, buckle up.
Note
super impressive 10-day chart - stay strong stay long Dash fans.Trade active
Bitcoin is a complete wrecking ball at the moment, it is amazing it commands so much dominance over the market.Following the Bitcoin capitulation price action on Dash has now reached the 200-week EMA (red line) with a wick down to the 300-week EMA. This is ridiculous.
Naturally the oversold condition now exists with ‘great buy’ signal illuminated.
Furthermore the ‘hash ribbon’ (bottom oscillator) has now illuminated the ‘buy’ signal. A very reliable signal for trend reversal.
I’m expecting a ‘V’ shaped recovery with most of the alts in the weeks ahead. The sell off was too fast too sharp, like March of 2020, price action quickly recovers.
On the weekly chart price action has reached past support & resistance, look left.
WW
Daily chart:
Weekly chart:
Note
This is an opportunity... I know coming down from $400 to current levels is painful, a beautiful swing trade option was available had I being paying attention to this one, hindsight is a wonderful thing. That time has passed.On the weekly chart below price action continues to make higher highs higher lows. The trend is your friend.
The orange line represents multiple monthly resistance candle tops. Switch to monthly chart and you’ll see, (with all this volatility it makes a lot of sense to look at the larger time frames). The monthly candles tops are approximately at $114, it is very unlikely this level is broken, it took years to make.
What else... the uptrend. The price action uptrend with the most confluence among candle bodies is identified. Price action is currently testing this support.
The bearish:
RSI is < 50. As long as that remains price action will likely bleed. Look left. RSI came up and was rejected by the 50 line. It is now trending towards 40 line. It must hold this level. Watch closely how this weekly candle closes, above 40?
Those yellow circles also tell an interesting story, they mark where RSI was recently at 80 AND rejected by 50 before testing 40 as support. In the last 4 occasions 3 were bullish one bearish. The odds favour the bulls.
Stochastic RSI < 5 on the weekly. That is crazy. Yes it is bearish the longer is sits here, again look left. However do consider this, the best buying opportunities are when below 20, never mind 5!
Trade active
Get some...Note
Today buyers have a chance to purchase Dash like its March 2017 all over again!Just even saying Dash is at the same price today as it was in March 2017 is a statement in of itself.
Note
Above “Today is like buying Dash in March 2017 all over again”. Up 40% since then. Amazing.What about ahead?
Watch the $620 area circled in purple. It is going to be a battle to get past this level - look left. If this level becomes support, bigger moves lie ahead. Much bigger. But we need to see support before we talk about that.
The bigger picture..
Ever since the 21-week EMA crossed the 50-week EMA Dash has been printing higher highs / higher lows. That has not changed. Be patient.
Trade active
Some nice higher lows are printing throughout price action and the oscillators. Clearly a strong upward trend.Should arrive at the $600 area by late October if this trend continues.
Note
When Dash did this in 2016 this happened5 years later until it repeats!
What did I just look at?
Those are 2-day time frame charts showing you what happens when price action breaks through the 50-day and 200-day EMAs (blue and red lines here would be shown on a 1-day chart except drawn here on a 2-day to remove noise).
Buckle up, a big move is coming.
Trade active
Dash is about to make a ridiculous move that might astonish.On the daily chart below (purple) circle price action has broken through several resistances and now confirmed them as support. $290 is the first resistance to be tested.
Note
Price action did move up 350% from when this idea was published, however the 21-week is very probably going to cross down the 50-week with the close of this week.There is no trade to be made here until the ascending triangle formation breaks out, which is projected to occur by Mid-March.
BTC
bc1q2eckdzh0q8vsd7swcc8et6ze7s99khhxyl7zwy
Weblink: patreon.com/withoutworries
Allow 3-6 months on ideas. Not investment advice. DYOR
bc1q2eckdzh0q8vsd7swcc8et6ze7s99khhxyl7zwy
Weblink: patreon.com/withoutworries
Allow 3-6 months on ideas. Not investment advice. DYOR
Disclaimer
The information and publications are not meant to be, and do not constitute, financial, investment, trading, or other types of advice or recommendations supplied or endorsed by TradingView. Read more in the Terms of Use.