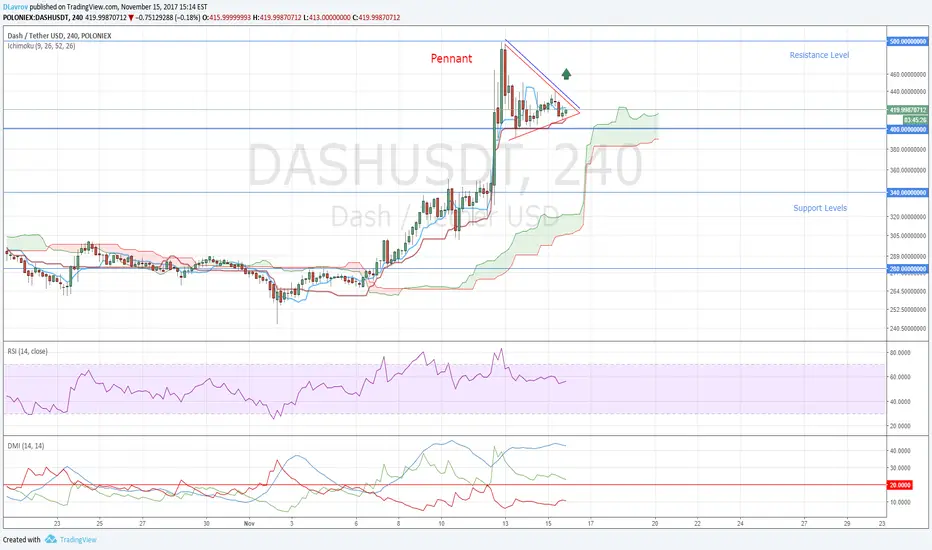
The market give us a new buy opportunity. A pennant chart pattern tells us about further upward movement. But for this the price will have to break the resistance level of the pennant. If so, this pattern will be realized as a continuation chart pattern. Long trades can be opened based on a breakout signal. Entry level is 443.00 with stop at 388.00 level. Profit targets are at 500.00 and 550.00 levels. This trading signal is not the perfect one. DMI gives a bullish signal, but ADX starts falling and we should be ready to see short term downward movement. But for this the market has to break support zone formed by Kijun line and 400.00 support level. If the price bounces from this zone, it will be a confirmation of further upward movement.
💰COPY MY TRADES FOR FREE! Join 👉 bit.ly/41DKDBD
📣 Get Welcome Bonuses for 1st Trade 👉 bit.ly/bonus_bybit
💎 Share My BEST Trades here 👉 bit.ly/wubits
📣 Get Welcome Bonuses for 1st Trade 👉 bit.ly/bonus_bybit
💎 Share My BEST Trades here 👉 bit.ly/wubits
Disclaimer
The information and publications are not meant to be, and do not constitute, financial, investment, trading, or other types of advice or recommendations supplied or endorsed by TradingView. Read more in the Terms of Use.