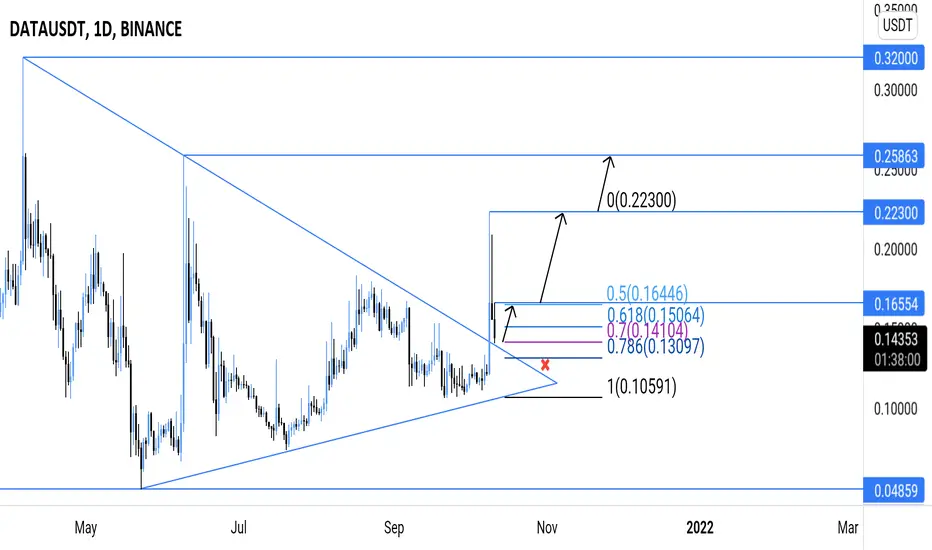
ANALYSIS 🔎
- DATA/USDT brokeout above the symmetrical triangle's inclined resistance as expected from my previous analysis.
- This is a bullish signal.
- Price then hit a swing high (@0.223) and retraced.
- Price is retesting the key fibonacci retracement zone (0.5 - 0.618 - 0.786) and symmetrical triangle's inclined resistance.
- There's a high concentration of buyers at this zone.
- There's an uptrend continuation potential.
BUY ENTRY ⬆️
- Current market price.
TARGETS 🎯
- Horizontal resistance level (@0.16554).
- Horizontal resistance level (@0.22300).
- Horizontal resistance level (@0.25863).
SETUP INVALIDATION ❌
- Breakdown below the 0.786 fibonacci retracement level (@0.13097).
Related publications
Disclaimer
The information and publications are not meant to be, and do not constitute, financial, investment, trading, or other types of advice or recommendations supplied or endorsed by TradingView. Read more in the Terms of Use.
Related publications
Disclaimer
The information and publications are not meant to be, and do not constitute, financial, investment, trading, or other types of advice or recommendations supplied or endorsed by TradingView. Read more in the Terms of Use.