First of all, I am not a fan of the current stock market situation, and I agree that a larger correction is long overdue.
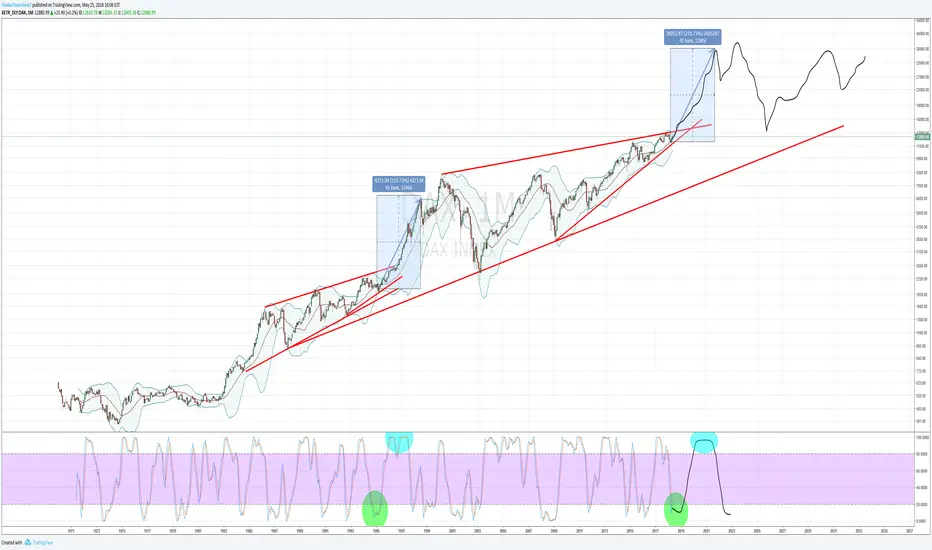
However, if I analyse the longterm chart of DAX, I see that the very long streak from 1982 to 1996 is similar in its fractal similarity to the streak from 2010 till now.
This is just a pure chart fractal analysis, and noting that long term rising wedges tend to be broken to the upside.
So, could it actually be that instead of a much needed longer correction, this crazy thing will climb even more? I hope not, but according to the charts it could very well be.
However, I am also prepared for a brutal correction, just in case.
Disclaimer
The information and publications are not meant to be, and do not constitute, financial, investment, trading, or other types of advice or recommendations supplied or endorsed by TradingView. Read more in the Terms of Use.
Disclaimer
The information and publications are not meant to be, and do not constitute, financial, investment, trading, or other types of advice or recommendations supplied or endorsed by TradingView. Read more in the Terms of Use.