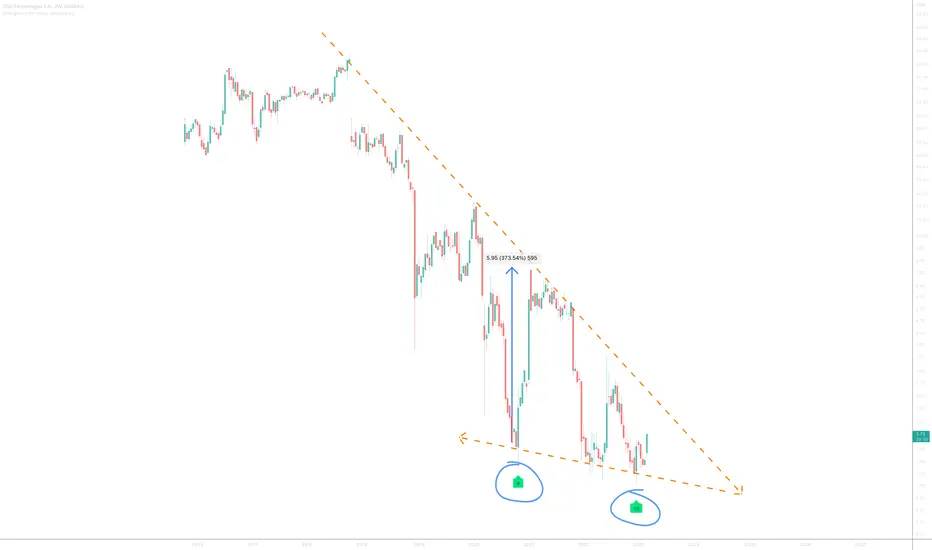
On the above bi-weekly chart price action has corrected over 95% since the sell signal (not shown). Now is an excellent long moment. Why?
1) A strong buy signal (not shown).
2) Price action is printing strong bullish divergence, look left.
3) No stock splits.
Is it possible price action falls further? Sure.
Is it probable? No.
Ww
Type: investment
Risk: <=6% of portfolio
Timeframe: Don’t know.
Return: Don’t know
Stop loss: <= 96 cents
1) A strong buy signal (not shown).
2) Price action is printing strong bullish divergence, look left.
3) No stock splits.
Is it possible price action falls further? Sure.
Is it probable? No.
Ww
Type: investment
Risk: <=6% of portfolio
Timeframe: Don’t know.
Return: Don’t know
Stop loss: <= 96 cents
Trade active
GRM support confirmed. Actually two confirmations now since late March, which is mated with volume. Almost if someone knew in advance...BTC
bc1q2eckdzh0q8vsd7swcc8et6ze7s99khhxyl7zwy
Weblink: patreon.com/withoutworries
Allow 3-6 months on ideas. Not investment advice. DYOR
bc1q2eckdzh0q8vsd7swcc8et6ze7s99khhxyl7zwy
Weblink: patreon.com/withoutworries
Allow 3-6 months on ideas. Not investment advice. DYOR
Disclaimer
The information and publications are not meant to be, and do not constitute, financial, investment, trading, or other types of advice or recommendations supplied or endorsed by TradingView. Read more in the Terms of Use.
BTC
bc1q2eckdzh0q8vsd7swcc8et6ze7s99khhxyl7zwy
Weblink: patreon.com/withoutworries
Allow 3-6 months on ideas. Not investment advice. DYOR
bc1q2eckdzh0q8vsd7swcc8et6ze7s99khhxyl7zwy
Weblink: patreon.com/withoutworries
Allow 3-6 months on ideas. Not investment advice. DYOR
Disclaimer
The information and publications are not meant to be, and do not constitute, financial, investment, trading, or other types of advice or recommendations supplied or endorsed by TradingView. Read more in the Terms of Use.