One of my favorite coins in the crypto space = Decred. Built from the btcd Bitcoin node implementation, the coin was created in 2016 as an alternative option to Bitcoin. Known as the first (and one of the only) true hybrid consensus algo coins, Decred was a game changer when they first popped on the scene.
Now granted, they have not reached the same market cap as some of the more recent coins in existence, like Tezos; Decred is proven tech. We won’t get too deep into what Decred does, but let’s go ahead and take a look at the price action on the coin and see what conclusions we can come to here.

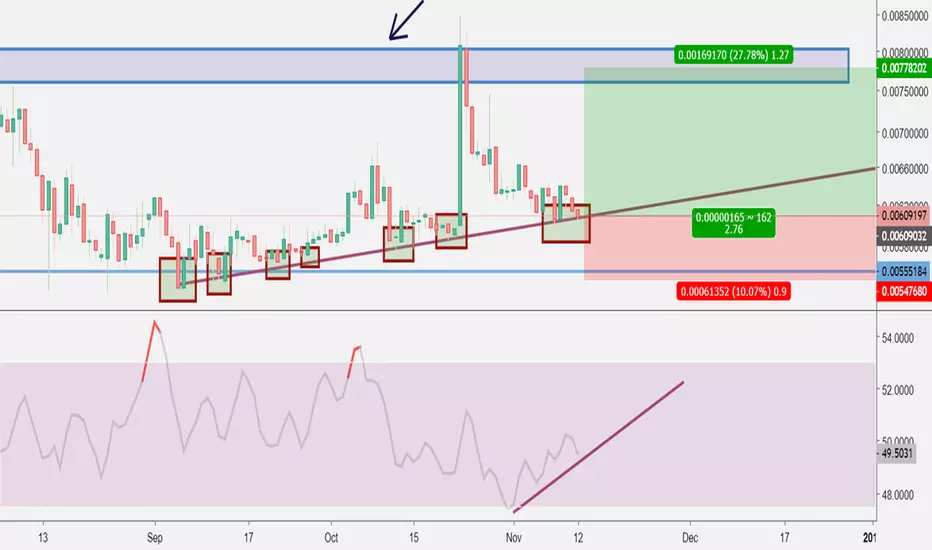
Now, at first glance, the chart above may seem a bit intimidating but let us explain:
1. The blue lines that you see on the chart above are support and resistance points.
2. If there is a blue line that is above the price, then it is a resistance point.
3. If the blue line is below where the price is, then it is a support point.
4. The red boxes are all of the different times that the price has ‘bounced’ off of one of the support/resistance points.
5. Support/resistance points are able to change at will. For example, if a price manages to cross above a resistance point, then that resistance point will become a support until the price breaks south of it once more; at which point, it would become a resistance point once again.
We made sure to put all of those points on a chart for you as well, so that you can integrate the points above with a visual a little easier:

Now let’s zoom in a bit to get a better idea of the price action on Decred DCR
DCR

There are a few observations that we should make here:

The underlying support for Decred on the daily resolution is extraordinarily well-tested, making it an extremely reliable indicator of impending bounces for Decred’s future price action.
Of course, this is important because the price at the time of writing is currently nudging against said support line. Also, common logic and trading convention tells us that a point/zone being well-tested without the price actually breaking through is indicative of that area’s strength (in terms of support or resistance).
Therefore, we can trust this resistance with relative confidence. Especially when considering the fact that there is a support that is just a tad bit lower than where Decred is currently.

Now, let’s check on where the overhead resistance would lie at:

Relative Strength Index(14) [Daily Resolution]

The RSI(14) isn’t really telling us any crazy information at this point in time, but its definitely something that’s worth paying attention to though.
Balance of Power RSI

Balance of Power RSI here is fairly ambiguous as well. What we can detect though is that there appears to be a recent increase in accumulation, which does diverge (positively) with the price action.
We outlined this most recent portion of Decred via a trendline graphic on TradingView at the end of the chart.

Everything there is to say about the Ichimoku for Decred has been said in the chart above.
So, let’s move on to the Fibonacci Levels (Fixed; Preset this time)
Fibonacci Levels

Zerononcense Reversion Ribbon V2 for Decred

Conclusion
Decred is something that could really bust out of the recent rut that its been in.
For that reason, we have a definitive R/R in mind for $DCR.

Disclaimer: This is not trading/investment advice. This idea was not created by someone that has any type of holding in Decred or any of its competitors.
Now granted, they have not reached the same market cap as some of the more recent coins in existence, like Tezos; Decred is proven tech. We won’t get too deep into what Decred does, but let’s go ahead and take a look at the price action on the coin and see what conclusions we can come to here.
Now, at first glance, the chart above may seem a bit intimidating but let us explain:
1. The blue lines that you see on the chart above are support and resistance points.
2. If there is a blue line that is above the price, then it is a resistance point.
3. If the blue line is below where the price is, then it is a support point.
4. The red boxes are all of the different times that the price has ‘bounced’ off of one of the support/resistance points.
5. Support/resistance points are able to change at will. For example, if a price manages to cross above a resistance point, then that resistance point will become a support until the price breaks south of it once more; at which point, it would become a resistance point once again.
We made sure to put all of those points on a chart for you as well, so that you can integrate the points above with a visual a little easier:
Now let’s zoom in a bit to get a better idea of the price action on Decred
There are a few observations that we should make here:
The underlying support for Decred on the daily resolution is extraordinarily well-tested, making it an extremely reliable indicator of impending bounces for Decred’s future price action.
Of course, this is important because the price at the time of writing is currently nudging against said support line. Also, common logic and trading convention tells us that a point/zone being well-tested without the price actually breaking through is indicative of that area’s strength (in terms of support or resistance).
Therefore, we can trust this resistance with relative confidence. Especially when considering the fact that there is a support that is just a tad bit lower than where Decred is currently.
Now, let’s check on where the overhead resistance would lie at:
Relative Strength Index(14) [Daily Resolution]
The RSI(14) isn’t really telling us any crazy information at this point in time, but its definitely something that’s worth paying attention to though.
Balance of Power RSI
Balance of Power RSI here is fairly ambiguous as well. What we can detect though is that there appears to be a recent increase in accumulation, which does diverge (positively) with the price action.
We outlined this most recent portion of Decred via a trendline graphic on TradingView at the end of the chart.
Everything there is to say about the Ichimoku for Decred has been said in the chart above.
So, let’s move on to the Fibonacci Levels (Fixed; Preset this time)
Fibonacci Levels
Zerononcense Reversion Ribbon V2 for Decred
Conclusion
Decred is something that could really bust out of the recent rut that its been in.
For that reason, we have a definitive R/R in mind for $DCR.
Disclaimer: This is not trading/investment advice. This idea was not created by someone that has any type of holding in Decred or any of its competitors.
Trade closed manually
Trade busted :( Got lazy and did not close this one in time.
This is a S/L'd trade. Going to have to put this one in the loss column.
Sorry everyone! I'll do better next time.
Disclaimer
The information and publications are not meant to be, and do not constitute, financial, investment, trading, or other types of advice or recommendations supplied or endorsed by TradingView. Read more in the Terms of Use.
Disclaimer
The information and publications are not meant to be, and do not constitute, financial, investment, trading, or other types of advice or recommendations supplied or endorsed by TradingView. Read more in the Terms of Use.