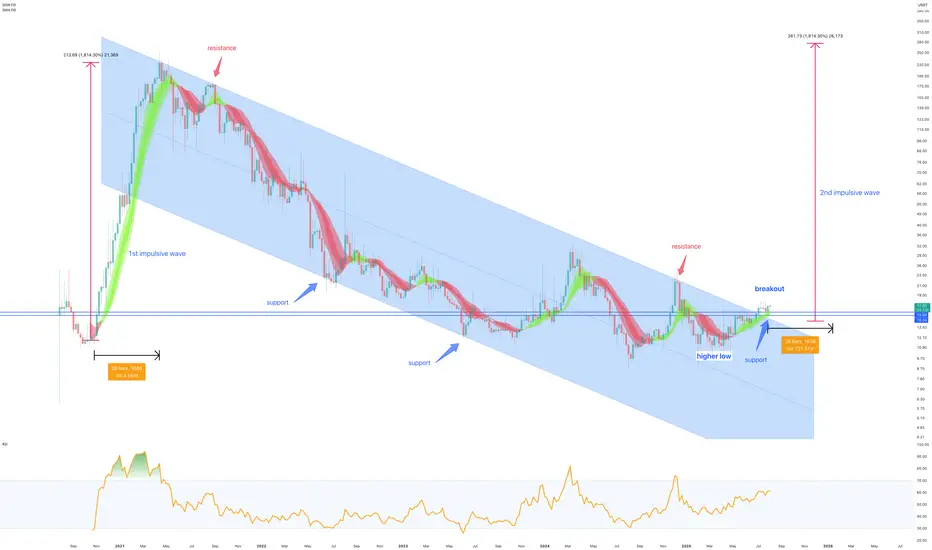
On the above 6 day chart price action is shown with a 95% correction since April 2021. A number of reasons now exist for a bullish outlook, including:
Support and resistance
Trend reversal
1st and 2nd impulsive waves
Summary
The flag set up is fairly reliable with a high success rate for continuation at 60% probability. However avoid greed at the forecast area, many people entered the market at $210 in 2021. For every seller there was a buyer at those levels now experiencing extreme despair eager to exit. Do not be their exit liquidity!
Whether the forecast is met or not expect a significant correction in price action to follow after September.
Is it possible price action continues lower? Sure.
Is it probable? No.
Ww
Support and resistance
Price action confirms support after 4 years of resistance. On both downtrend and horizontal resistances.
Trend reversal
The support confirmation is followed by higher low and higher high prints in RSI with higher low print in price action.
1st and 2nd impulsive waves
A measured move from the first impulsive wave will see price action move to the previous all time high between $210 and $250
Summary
The flag set up is fairly reliable with a high success rate for continuation at 60% probability. However avoid greed at the forecast area, many people entered the market at $210 in 2021. For every seller there was a buyer at those levels now experiencing extreme despair eager to exit. Do not be their exit liquidity!
Whether the forecast is met or not expect a significant correction in price action to follow after September.
Is it possible price action continues lower? Sure.
Is it probable? No.
Ww
Trade active
Active on publicationBTC
bc1q2eckdzh0q8vsd7swcc8et6ze7s99khhxyl7zwy
Weblink: patreon.com/withoutworries
Allow 3-6 months on ideas. Not investment advice. DYOR
bc1q2eckdzh0q8vsd7swcc8et6ze7s99khhxyl7zwy
Weblink: patreon.com/withoutworries
Allow 3-6 months on ideas. Not investment advice. DYOR
Disclaimer
The information and publications are not meant to be, and do not constitute, financial, investment, trading, or other types of advice or recommendations supplied or endorsed by TradingView. Read more in the Terms of Use.
BTC
bc1q2eckdzh0q8vsd7swcc8et6ze7s99khhxyl7zwy
Weblink: patreon.com/withoutworries
Allow 3-6 months on ideas. Not investment advice. DYOR
bc1q2eckdzh0q8vsd7swcc8et6ze7s99khhxyl7zwy
Weblink: patreon.com/withoutworries
Allow 3-6 months on ideas. Not investment advice. DYOR
Disclaimer
The information and publications are not meant to be, and do not constitute, financial, investment, trading, or other types of advice or recommendations supplied or endorsed by TradingView. Read more in the Terms of Use.
