📍 Macro Overview:
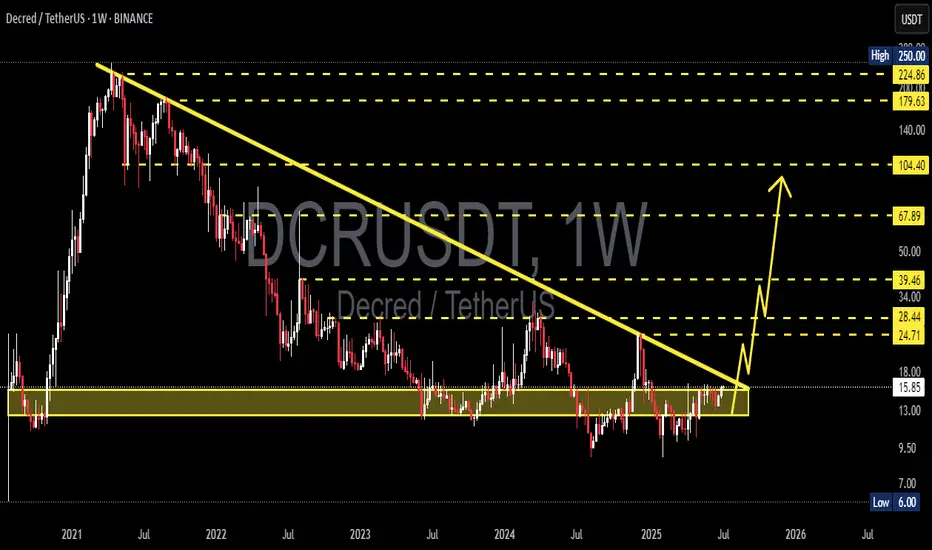
After being trapped in a multi-year downtrend since early 2021, Decred (DCR) has now shown signs of a major breakout from the long-term descending trendline. This moment could mark a pivotal shift from accumulation to expansion, offering a strong bullish macro setup.
🧠 Technical Pattern & Structure Analysis:
🔸 Dominant Pattern:
A long-standing descending triangle has formed, with a solid demand zone between $11.00 - $13.00, tested multiple times over the past 2 years.
While traditionally a bearish pattern, breaking to the upside here signals a reversal structure and the start of bullish momentum.
🔸 Breakout Confirmation:
Price has now clearly broken above the long-term downtrend line originating from the 2021 top.
This breakout implies a macro trend shift, opening the door for a series of higher highs and higher lows.
🔸 Strong Accumulation Zone:
The yellow zone ($11–$13) has proven to be a high-conviction demand area, likely indicating institutional accumulation.
✅ Bullish Scenario (High Probability):
If the breakout holds and volume confirms:
📌 Key Upside Targets:
1. $24.71 → First major resistance
2. $28.44 → Psychological level and historical S/R flip
3. $34.00 → Local top from recent past
4. $39.46 → Strong horizontal resistance
5. $67.89 → 2022 resistance and bullish confirmation level
6. $104.40 → Mid-term parabolic extension target
📈 Likely structure: Breakout → Retest → Multi-wave rally upward.
> Strategy: Ideal for Buy on Retest or Swing Long setups.
❌ Bearish Scenario (Low Probability – Risk Management):
If the breakout fails and price dips back below $13:
Expect potential pullback to $11.00 - $10.00 support
Worst-case bearish continuation could revisit $6.00 (macro support)
Would signal a false breakout and continuation of the bearish trend
> Risk Strategy: Watch the volume – weak volume could imply a fakeout.
🔍 Supporting Technical Signals:
📊 Volume: Strong volume confirmation is essential for breakout validity
📈 Indicators Supporting Bullish Bias:
Weekly RSI hovering at neutral-bullish zones
Potential for a weekly EMA crossover (golden cross)
OBV shows signs of increasing accumulation pressure
🧭 Conclusion & Strategy Insight:
This chart is signaling a high-conviction macro opportunity.
Breaking out from a 3-year downtrend is a rare technical event that has historically led to exponential moves. The key is confirmation through volume and healthy consolidation above the breakout line.
> "The longer the base, the stronger the breakout."
#DCR #Decred #AltcoinBreakout #MacroReversal #CryptoChartAnalysis #BullishSetup #CryptoTechnicalAnalysis #TrendReversal #AltcoinSeason
✅ Get Free Signals! Join Our Telegram Channel Here: t.me/TheCryptoNuclear
✅ Twitter: twitter.com/crypto_nuclear
✅ Join Bybit : partner.bybit.com/b/nuclearvip
✅ Benefits : Lifetime Trading Fee Discount -50%
✅ Twitter: twitter.com/crypto_nuclear
✅ Join Bybit : partner.bybit.com/b/nuclearvip
✅ Benefits : Lifetime Trading Fee Discount -50%
Disclaimer
The information and publications are not meant to be, and do not constitute, financial, investment, trading, or other types of advice or recommendations supplied or endorsed by TradingView. Read more in the Terms of Use.