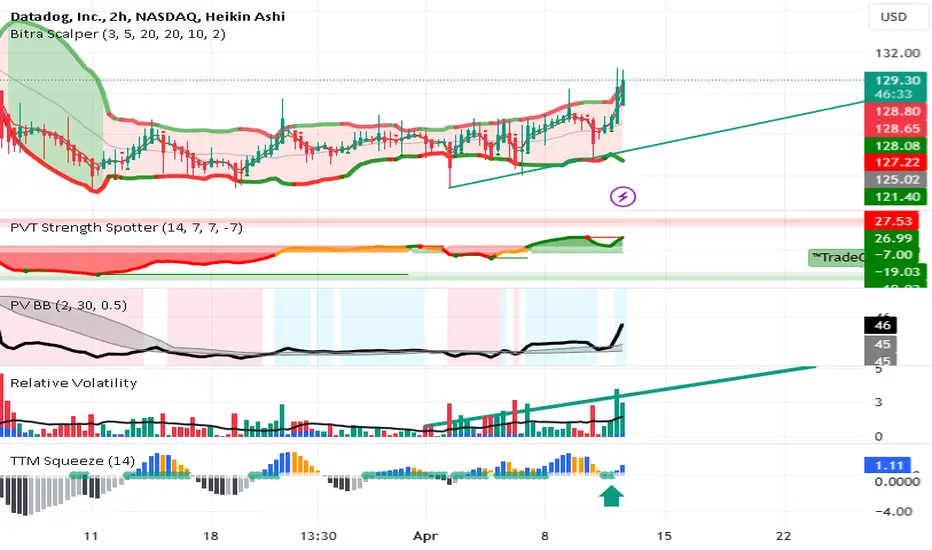
DDOG on a 120 minute chart is breaking above narrow Bollinger Bands as they begin to
release the squeeze. The relative volailitiy indicator shows red to green and increasing
volatility. The price volume indicators show the bullish trend while the TTM squeeze
just signaled green. I will tkae a long trade here focused on the price action leading to the
earnings report due May 3rd.
release the squeeze. The relative volailitiy indicator shows red to green and increasing
volatility. The price volume indicators show the bullish trend while the TTM squeeze
just signaled green. I will tkae a long trade here focused on the price action leading to the
earnings report due May 3rd.
Trade active
Trade is now risk free. Stop loss converted to a trailing 3% loss making the trade low maintenance and risk off from the move up today.Disclaimer
The information and publications are not meant to be, and do not constitute, financial, investment, trading, or other types of advice or recommendations supplied or endorsed by TradingView. Read more in the Terms of Use.
Disclaimer
The information and publications are not meant to be, and do not constitute, financial, investment, trading, or other types of advice or recommendations supplied or endorsed by TradingView. Read more in the Terms of Use.