Ascending Trendline/Channel:
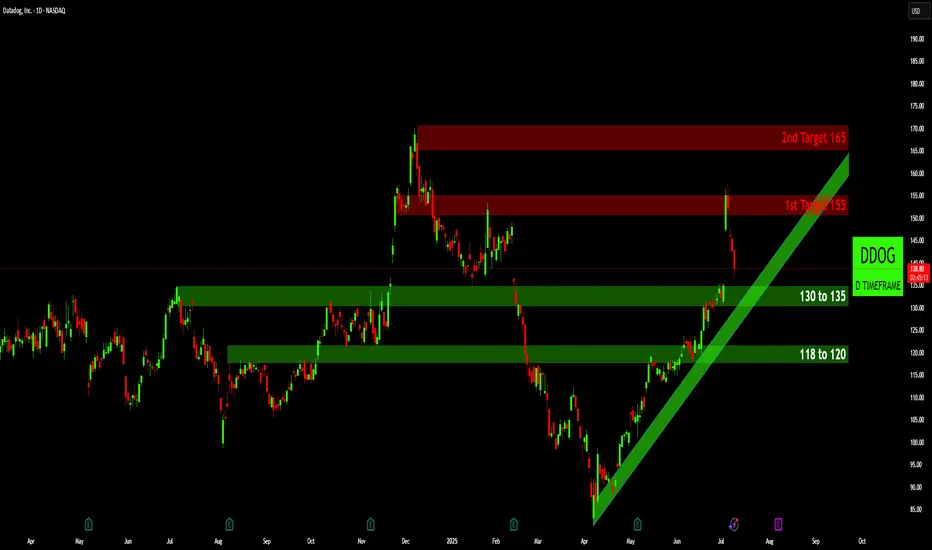
o A prominent green ascending trendline, starting from the lows in April, defines the current bullish momentum.
o This trendline has acted as dynamic support, with the price bouncing off it on multiple occasions. As long as the price remains above this line, the intermediate-term uptrend is considered intact.
Key Support Zones (Green Bands):
o Primary Support (130 to 135): This is the most immediate and critical support zone. Historically, this area acted as resistance in late 2024 and early 2025. Now, it is being tested as potential support—a classic example of a "role reversal" or "polarity" principle. The price is currently trading just above this zone.
o Secondary Support (118 to 120): If the primary support at 130-135 fails to hold, the next significant level of support is identified between 118 and 120. This zone provided support in the latter part of 2024.
Key Resistance / Target Zones (Red Bands):
o 1st Target / Resistance (~155): This level represents the first major overhead resistance. The chart shows a recent sharp rejection from this area, which initiated the current downward move. For the uptrend to continue, bulls would need to break and hold above this zone.
o 2nd Target / Resistance (~165): Should the price overcome the 155 level, the next major resistance is identified around 165. This corresponds to the major high seen at the end of 2024.
Current Price Action:
DDOG recently tested the resistance near 155 and has since pulled back. The price is now situated at a crucial juncture, hovering above the primary support zone of 130-135 and approaching the main ascending trendline.
Summary of Observations:
The confluence of the horizontal support zone (130-135) and the ascending trendline creates a significant area of interest.
• A hold and bounce from this confluence could signal a continuation of the uptrend, with the 155 and 165 levels as the next potential upside objectives.
• A decisive break below both the 130 level and the ascending trendline could signal a shift in momentum and may lead to a deeper correction, with the 118-120 zone as the next major support to watch.
Disclaimer:
The information provided in this chart is for educational and informational purposes only and should not be considered as investment advice. Trading and investing involve substantial risk and are not suitable for every investor. You should carefully consider your financial situation and consult with a financial advisor before making any investment decisions. The creator of this chart does not guarantee any specific outcome or profit and is not responsible for any losses incurred as a result of using this information. Past performance is not indicative of future results. Use this information at your own risk. This chart has been created for my own improvement in Trading and Investment Analysis. Please do your own analysis before any investments.
Disclaimer
The information and publications are not meant to be, and do not constitute, financial, investment, trading, or other types of advice or recommendations supplied or endorsed by TradingView. Read more in the Terms of Use.
Disclaimer
The information and publications are not meant to be, and do not constitute, financial, investment, trading, or other types of advice or recommendations supplied or endorsed by TradingView. Read more in the Terms of Use.