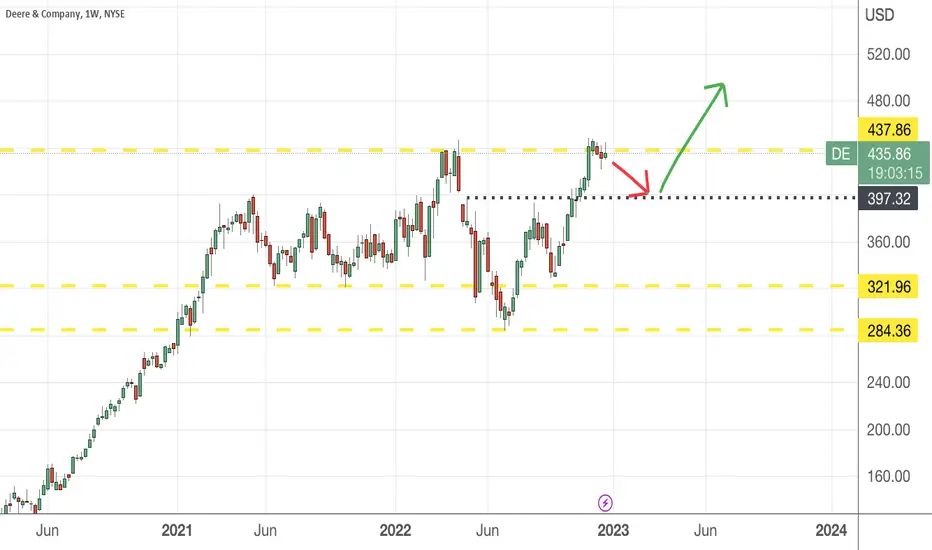
The weekly chart looks impressive with a strong rally since March 2020....
It is now in a peak zone where the probability of it retracing to 397 price level is quite high.
Once it reaches there, wait for bullish signal before going LONG. If it falls further to 284 to 321, that would be much more attractive price to get in.
It is now in a peak zone where the probability of it retracing to 397 price level is quite high.
Once it reaches there, wait for bullish signal before going LONG. If it falls further to 284 to 321, that would be much more attractive price to get in.
Note
strong resistance at 425.05, wait for the breakout with bullish signal firstDisclaimer
The information and publications are not meant to be, and do not constitute, financial, investment, trading, or other types of advice or recommendations supplied or endorsed by TradingView. Read more in the Terms of Use.
Disclaimer
The information and publications are not meant to be, and do not constitute, financial, investment, trading, or other types of advice or recommendations supplied or endorsed by TradingView. Read more in the Terms of Use.