In addition to the previous post on US/German 2 year yield spread, here I show you how it could really work from the german Schatz sell side!
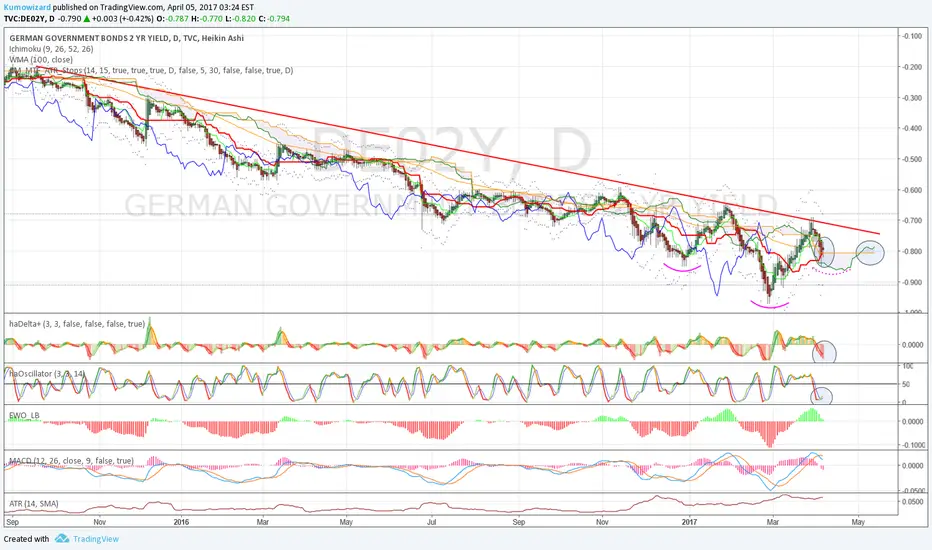
This chart shows the German 2 year Schatz yield.
- Long term trend is bearish, but the trendline is coming lower. Right now the break point is around minus 70 bps. (-0,70 %)
- Ichimoku has BULLISH bias ahead: Senkou A is above Senkou B (positive forward Kumo). Tenkan is above Kijun, and both are slightly above spot could now.
- Heikin-Ashi shows indecision at the -0,80 - 0,85 key support zone! Doji candle, haDelta+ and haOscillator are reversing up from their lows.
- MACD crossed below the signal line, but it is still positive above zero.
- EWO is positive too
It is not a bad risk reward to short Schatz at -80 bps in some medium size.
Here you can also observe a possibly building inverse Head and Shoulders pattern. If its neckline breaks, that would be in line with a trendline break too. Then my friends do not hesitate, just sell all size on EUB2Y you can allow to sell.
This chart shows the German 2 year Schatz yield.
- Long term trend is bearish, but the trendline is coming lower. Right now the break point is around minus 70 bps. (-0,70 %)
- Ichimoku has BULLISH bias ahead: Senkou A is above Senkou B (positive forward Kumo). Tenkan is above Kijun, and both are slightly above spot could now.
- Heikin-Ashi shows indecision at the -0,80 - 0,85 key support zone! Doji candle, haDelta+ and haOscillator are reversing up from their lows.
- MACD crossed below the signal line, but it is still positive above zero.
- EWO is positive too
It is not a bad risk reward to short Schatz at -80 bps in some medium size.
Here you can also observe a possibly building inverse Head and Shoulders pattern. If its neckline breaks, that would be in line with a trendline break too. Then my friends do not hesitate, just sell all size on
Related publications
Disclaimer
The information and publications are not meant to be, and do not constitute, financial, investment, trading, or other types of advice or recommendations supplied or endorsed by TradingView. Read more in the Terms of Use.
Related publications
Disclaimer
The information and publications are not meant to be, and do not constitute, financial, investment, trading, or other types of advice or recommendations supplied or endorsed by TradingView. Read more in the Terms of Use.