Technical Analysis
Price Action & Chart Patterns
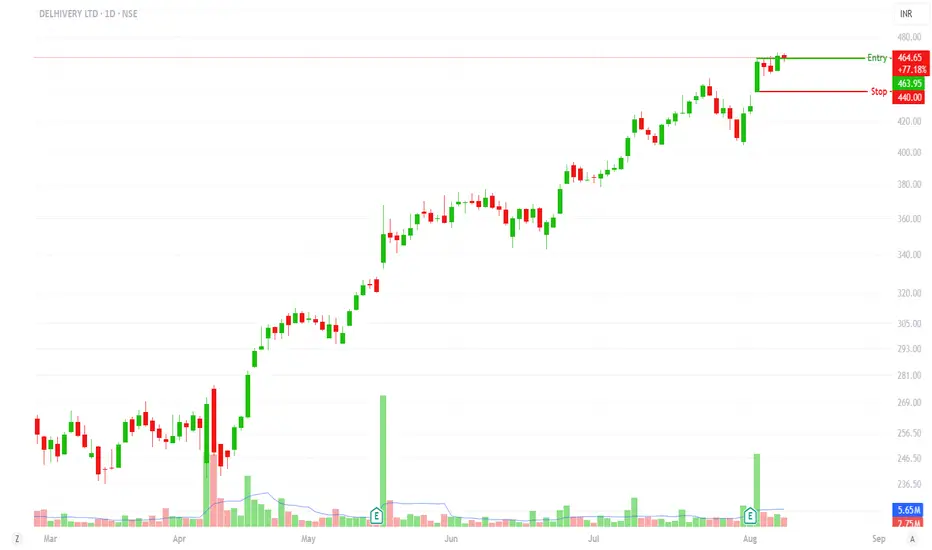
The attached chart shows Delhivery breaking out from a consolidation phase, with strong momentum since March 2025. Key technical observations:
Trend: Strong uptrend with higher highs and higher lows
Breakout: Clean breakout with volume confirmation
Current Position: Trading at 98.1% of 10-day range (₹409-₹466)
Risk Level: Well-defined at ₹440 (5.3% risk from current levels)
Support & Resistance Levels
Immediate Resistance: ₹468, ₹475, ₹485
Key Support: ₹440 (stop loss), ₹425, ₹409
52-Week Range: ₹237 - ₹468
Futures OI Insights
Current OI: 1.31 crore contracts (moderate levels)
Recent Trend: "Long Cover" on Aug 8, indicating profit booking by long positions
Peak OI: 1.46 crore on Jul 28 during aggressive long buildup
Interpretation: Healthy correction in OI after strong buildup, typical in trending markets
Options OI Analysis
Current PCR: 0.88 (moderately bullish)
PCR Range: 0.48 to 0.96 over the analyzed period
Call OI: 1.06 crore vs Put OI: 0.93 crore
Interpretation: Balanced positioning with slight call bias, supportive of upward movement
Risk Mitigation Strategies
Stop Loss: Strict adherence to ₹440 level
Position Sizing: Never exceed calculated position size
Profit Booking: Partial profits at ₹485, ₹500 levels
Trend Following: Exit if price breaks below ₹440 with volume
Price Targets with Risk-Reward
Target 1: ₹475 (2.2% return, Risk-Reward 1:0.42) - Conservative
Target 2: ₹485 (4.4% return, Risk-Reward 1:0.83) - Probable
Target 3: ₹500 (7.6% return, Risk-Reward 1:1.43) - Attractive
Target 4: ₹520 (11.9% return, Risk-Reward 1:2.25) - Optimistic
Ideal Position Size: 2% risk tolerance (₹20,000 max loss on ₹10L portfolio) = 811 shares for ₹3.77L investment.
Price Action & Chart Patterns
The attached chart shows Delhivery breaking out from a consolidation phase, with strong momentum since March 2025. Key technical observations:
Trend: Strong uptrend with higher highs and higher lows
Breakout: Clean breakout with volume confirmation
Current Position: Trading at 98.1% of 10-day range (₹409-₹466)
Risk Level: Well-defined at ₹440 (5.3% risk from current levels)
Support & Resistance Levels
Immediate Resistance: ₹468, ₹475, ₹485
Key Support: ₹440 (stop loss), ₹425, ₹409
52-Week Range: ₹237 - ₹468
Futures OI Insights
Current OI: 1.31 crore contracts (moderate levels)
Recent Trend: "Long Cover" on Aug 8, indicating profit booking by long positions
Peak OI: 1.46 crore on Jul 28 during aggressive long buildup
Interpretation: Healthy correction in OI after strong buildup, typical in trending markets
Options OI Analysis
Current PCR: 0.88 (moderately bullish)
PCR Range: 0.48 to 0.96 over the analyzed period
Call OI: 1.06 crore vs Put OI: 0.93 crore
Interpretation: Balanced positioning with slight call bias, supportive of upward movement
Risk Mitigation Strategies
Stop Loss: Strict adherence to ₹440 level
Position Sizing: Never exceed calculated position size
Profit Booking: Partial profits at ₹485, ₹500 levels
Trend Following: Exit if price breaks below ₹440 with volume
Price Targets with Risk-Reward
Target 1: ₹475 (2.2% return, Risk-Reward 1:0.42) - Conservative
Target 2: ₹485 (4.4% return, Risk-Reward 1:0.83) - Probable
Target 3: ₹500 (7.6% return, Risk-Reward 1:1.43) - Attractive
Target 4: ₹520 (11.9% return, Risk-Reward 1:2.25) - Optimistic
Ideal Position Size: 2% risk tolerance (₹20,000 max loss on ₹10L portfolio) = 811 shares for ₹3.77L investment.
Disclaimer
The information and publications are not meant to be, and do not constitute, financial, investment, trading, or other types of advice or recommendations supplied or endorsed by TradingView. Read more in the Terms of Use.
Disclaimer
The information and publications are not meant to be, and do not constitute, financial, investment, trading, or other types of advice or recommendations supplied or endorsed by TradingView. Read more in the Terms of Use.