Overview:
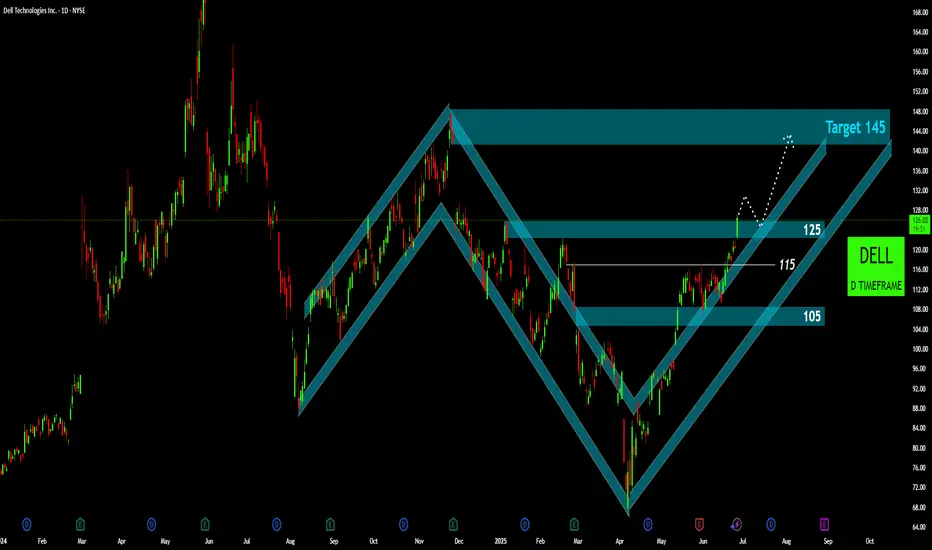
Dell Technologies ( DELL) has exhibited significant price action over the past year. After a strong uptrend culminating in a multi-month high around the Target 145 zone in late 2024, the stock underwent a substantial correction. However, since its April lows, DELL has initiated a robust recovery within a well-defined ascending channel, demonstrating clear bullish momentum.
Key Price Action & Patterns:
Prior Uptrend & All-Time High Test (August - December 2024): The initial phase of the chart showsDELL in a strong ascending channel, culminating in a peak within the Target 145 zone. This zone represents a significant historical resistance level, being the prior peak before the subsequent decline.
Corrective Phase & Bearish Channel (December 2024 - April): Following the rejection at the 145 zone,DELL entered a steep downtrend, breaking below key support levels and declining into April.
Bullish Reversal & Ascending Channel (April - Present): From its April lows,DELL has embarked on a powerful recovery, forming a clear ascending channel. This pattern is characterized by a series of higher highs and higher lows, indicating sustained buying pressure.
Critical Levels & Current Status:
105 (Lower Teal Zone): This level has acted as a crucial support point within the current ascending channel, marking a significant higher low in the ongoing recovery phase. It represents a strong demand zone.
115 (White Line): This horizontal line served as an intermediate resistance level in late May/early June before being decisively breached. It now technically functions as immediate support, offering a potential retest level on any pullback within the current uptrend.
125 (Current Teal Zone): This is a highly significant pivot zone. It previously acted as major support in late 2024 before the breakdown and later as resistance during the early stages of the recovery. The recent price action shows a decisive breakout above this 125-resistance zone, signifying strong bullish conviction.
Target 145 (Upper Teal Zone): As the prior multi-month high, this zone remains the primary overhead resistance and potential upside target following the breakout from the 125 level. The dotted line projection illustrates a common post-breakout scenario, where price might retest the breakout level (125, now as support) before potentially moving towards the 145 targets.
Technical Outlook:
The recent breakout above the 125 resistance is a strong technical development, confirming the strength of the current uptrend within the ascending channel. This move suggests that buyers are in control and are aiming for higher price levels. The immediate focus shifts to the validation of the 125 level as new support, followed by a potential advance towards the Target 145 zone. Continued price action within the ascending channel and above 115 would reinforce the bullish bias.
Disclaimer:
The information provided in this chart is for educational and informational purposes only and should not be considered as investment advice. Trading and investing involve substantial risk and are not suitable for every investor. You should carefully consider your financial situation and consult with a financial advisor before making any investment decisions. The creator of this chart does not guarantee any specific outcome or profit and is not responsible for any losses incurred as a result of using this information. Past performance is not indicative of future results. Use this information at your own risk. This chart has been created for my own improvement in Trading and Investment Analysis. Please do your own analysis before any investments.
Dell Technologies (
Key Price Action & Patterns:
Prior Uptrend & All-Time High Test (August - December 2024): The initial phase of the chart shows
Corrective Phase & Bearish Channel (December 2024 - April): Following the rejection at the 145 zone,
Bullish Reversal & Ascending Channel (April - Present): From its April lows,
Critical Levels & Current Status:
105 (Lower Teal Zone): This level has acted as a crucial support point within the current ascending channel, marking a significant higher low in the ongoing recovery phase. It represents a strong demand zone.
115 (White Line): This horizontal line served as an intermediate resistance level in late May/early June before being decisively breached. It now technically functions as immediate support, offering a potential retest level on any pullback within the current uptrend.
125 (Current Teal Zone): This is a highly significant pivot zone. It previously acted as major support in late 2024 before the breakdown and later as resistance during the early stages of the recovery. The recent price action shows a decisive breakout above this 125-resistance zone, signifying strong bullish conviction.
Target 145 (Upper Teal Zone): As the prior multi-month high, this zone remains the primary overhead resistance and potential upside target following the breakout from the 125 level. The dotted line projection illustrates a common post-breakout scenario, where price might retest the breakout level (125, now as support) before potentially moving towards the 145 targets.
Technical Outlook:
The recent breakout above the 125 resistance is a strong technical development, confirming the strength of the current uptrend within the ascending channel. This move suggests that buyers are in control and are aiming for higher price levels. The immediate focus shifts to the validation of the 125 level as new support, followed by a potential advance towards the Target 145 zone. Continued price action within the ascending channel and above 115 would reinforce the bullish bias.
Disclaimer:
The information provided in this chart is for educational and informational purposes only and should not be considered as investment advice. Trading and investing involve substantial risk and are not suitable for every investor. You should carefully consider your financial situation and consult with a financial advisor before making any investment decisions. The creator of this chart does not guarantee any specific outcome or profit and is not responsible for any losses incurred as a result of using this information. Past performance is not indicative of future results. Use this information at your own risk. This chart has been created for my own improvement in Trading and Investment Analysis. Please do your own analysis before any investments.
Disclaimer
The information and publications are not meant to be, and do not constitute, financial, investment, trading, or other types of advice or recommendations supplied or endorsed by TradingView. Read more in the Terms of Use.
Disclaimer
The information and publications are not meant to be, and do not constitute, financial, investment, trading, or other types of advice or recommendations supplied or endorsed by TradingView. Read more in the Terms of Use.