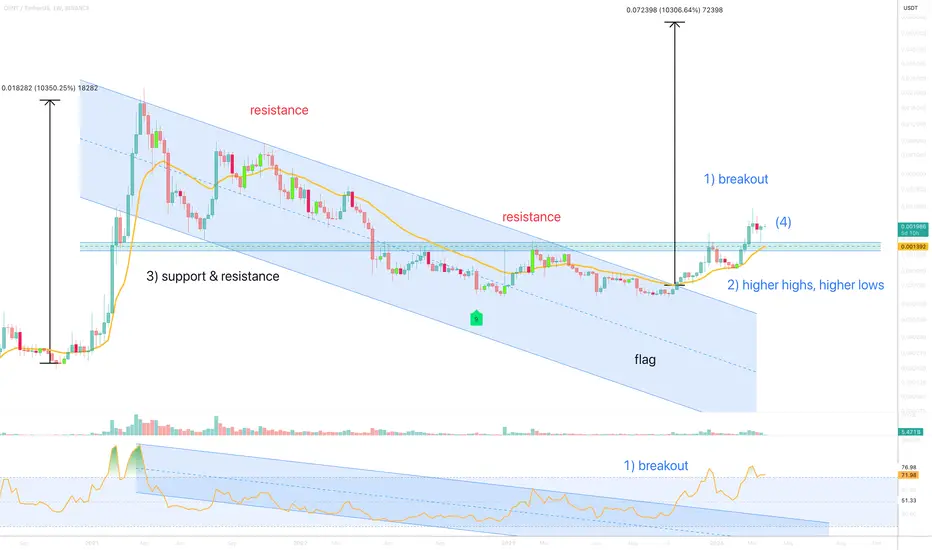
On the above weekly chart price action has corrected almost 99% since April 2021. A number of reasons now exist to be long. They include:
1) Price action and RSI resistance breakouts.
2) Trend reversal. Higher highs higher lows replace lower highs lower lows.
3) Support and resistance (green channel). Price action confirms support on past resistance.
4) A hammer candle prints on the weekly support and the 21-week EMA.
5) The target area is measured as price action prints a macro flag pattern. A measured move from the flagpole takes price action to 7 cents from the breakout. 100x
Is it possible price action corrects further? Sure.
Is it probable? No.
Ww
Type: trade
Risk: <= 6%
Timeframe for long: Remainder of March 2024
Return: 4000% from current levels
Trade active
Past resistance confirms support. On Multiple time frames.The next move could be impulsive just like FARM. Don't be the one of many folks who messages me with "I missed this one, do you think it will test the low again?"
Trade active
Price action is down 50% since publishing (black arrow). Big ideas don't deliver without the occasional bump in the road, this is crypto after all.Excellent long entry at this time. Why? Price action is on past resistance, look left, where it previously confirmed. Once the flag confirms, your patience will truly be tested.
Over the years these flag patterns have identified themselves time and time again, with FET, INJ, LCX, FRONT, Auction, all very random no rhyme or reason to it, they just were as DENT is now.
Weekly chart.
At this moment, adding to long entries is reasonable. Why? Cause the probability of an upward move is incredibly high.
Daily chart
Note
Last opportunity, then its over.BTC
bc1q2eckdzh0q8vsd7swcc8et6ze7s99khhxyl7zwy
Weblink: patreon.com/withoutworries
Allow 3-6 months on ideas. Not investment advice. DYOR
bc1q2eckdzh0q8vsd7swcc8et6ze7s99khhxyl7zwy
Weblink: patreon.com/withoutworries
Allow 3-6 months on ideas. Not investment advice. DYOR
Disclaimer
The information and publications are not meant to be, and do not constitute, financial, investment, trading, or other types of advice or recommendations supplied or endorsed by TradingView. Read more in the Terms of Use.
BTC
bc1q2eckdzh0q8vsd7swcc8et6ze7s99khhxyl7zwy
Weblink: patreon.com/withoutworries
Allow 3-6 months on ideas. Not investment advice. DYOR
bc1q2eckdzh0q8vsd7swcc8et6ze7s99khhxyl7zwy
Weblink: patreon.com/withoutworries
Allow 3-6 months on ideas. Not investment advice. DYOR
Disclaimer
The information and publications are not meant to be, and do not constitute, financial, investment, trading, or other types of advice or recommendations supplied or endorsed by TradingView. Read more in the Terms of Use.