Use this as a guide to develop your view of the situation.
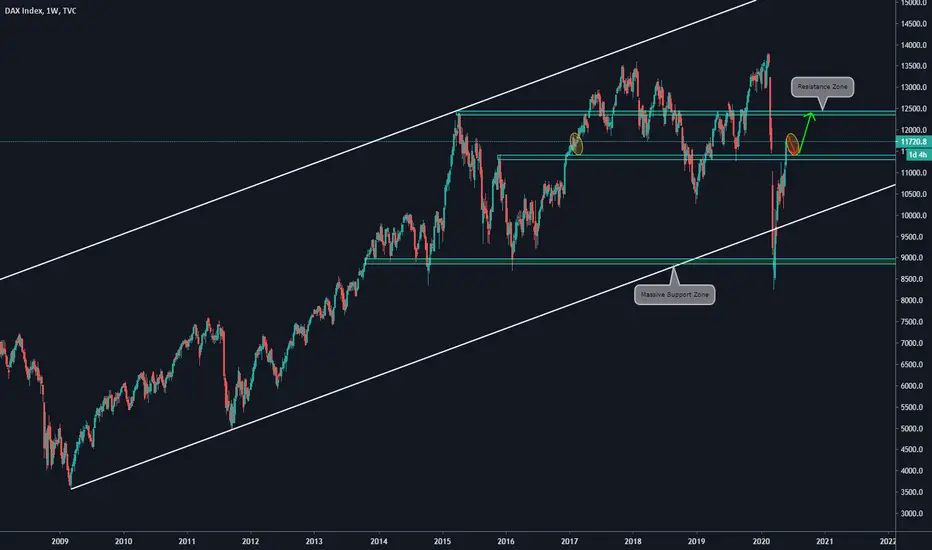
Main items we can see on the Weekly Chart:
a)The price broke with a bullish movement a previous Resistance Zone
b)Taking a look into the past, we can see a similar bullish movement than the current one
c)Using it as something to copy, we will wait for a correction on the current area
d)After that, we will set a long trade towards 12350
e)Of course, we will develop our setup on a lower timeframe, such as 4hs /1h. Use this chart as an idea of how long you should wait before the movement.
Disclaimer
The information and publications are not meant to be, and do not constitute, financial, investment, trading, or other types of advice or recommendations supplied or endorsed by TradingView. Read more in the Terms of Use.
Disclaimer
The information and publications are not meant to be, and do not constitute, financial, investment, trading, or other types of advice or recommendations supplied or endorsed by TradingView. Read more in the Terms of Use.