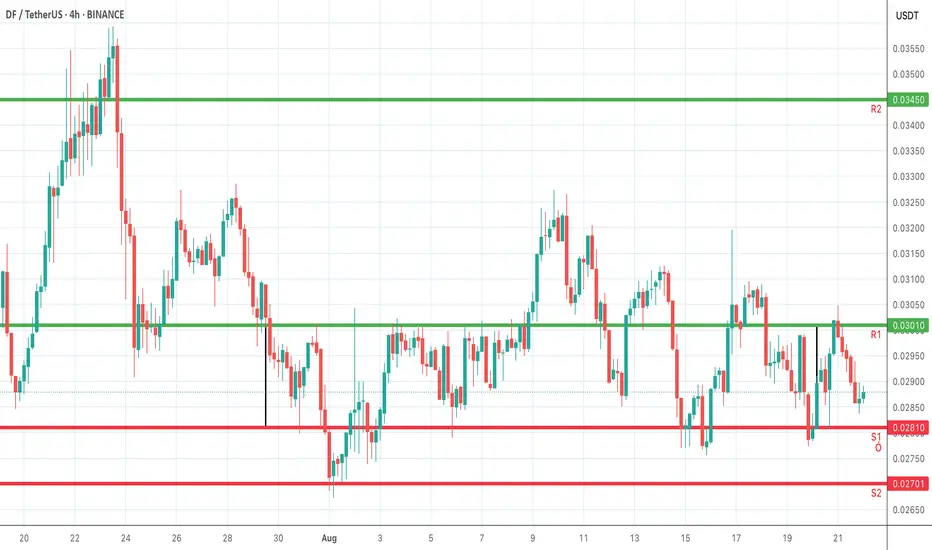
On the 4-hour chart, key support and resistance zones have been plotted. S1 and S2 represent the downside levels where demand could emerge, offering potential rebound points. R1 and R2 indicate resistance barriers on the upside, where selling pressure or profit-taking may appear. Monitoring price action around these levels is crucial: a breakout above resistance suggests bullish continuation, while a breakdown below support could signal further downside. Traders can align entries, exits, and stop-losses with these zones while confirming moves through trend and momentum indicators.
Disclaimer
The information and publications are not meant to be, and do not constitute, financial, investment, trading, or other types of advice or recommendations supplied or endorsed by TradingView. Read more in the Terms of Use.
Disclaimer
The information and publications are not meant to be, and do not constitute, financial, investment, trading, or other types of advice or recommendations supplied or endorsed by TradingView. Read more in the Terms of Use.