🔍 Pattern and Structure Analysis
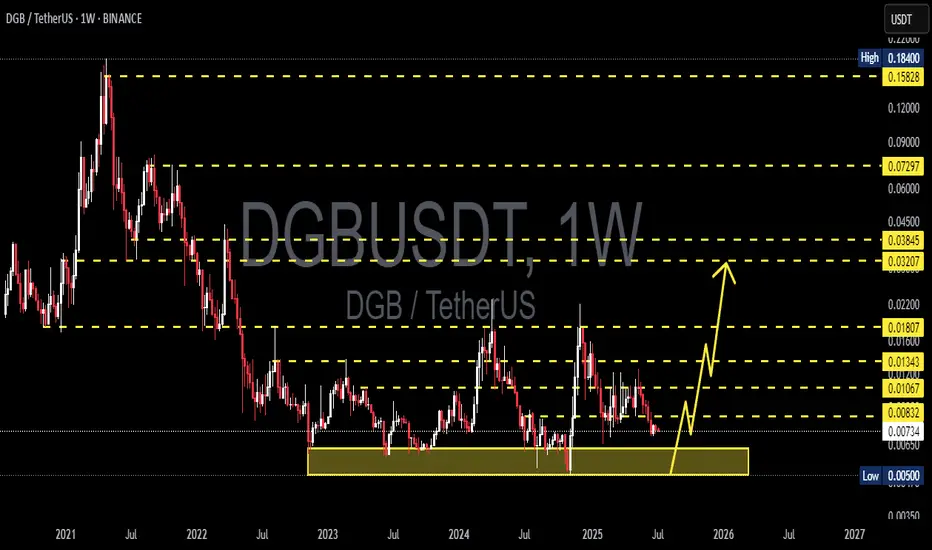
The DGB/USDT pair is currently testing a historical demand zone in the 0.00550 – 0.00733 USDT area (highlighted in yellow). This zone has proven to be a strong bounce area since mid-2022. The price structure is forming a large double bottom in this support zone, indicating a potential medium- to long-term bullish reversal pattern.
🟢 Bullish Scenario
If the price successfully holds and bounces from this support:
Short-term targets: 0.00832 – 0.01067 USDT
Mid-term targets: 0.01343 – 0.01807 USDT
Long-term targets: 0.03207 – 0.03845 USDT
This potential upside is supported by an emerging early-stage parabolic move, as illustrated by the yellow projection arrow. If volume increases and market sentiment improves, we may see a multi-wave recovery pattern unfold.
🔴 Bearish Scenario
However, if the price breaks down below the key support at 0.0055 USDT:
It may retest the all-time low around 0.00500 USDT
Such a breakdown would invalidate the long-standing support structure and may lead to further downside pressure
🧩 Pattern Summary
Pattern: Double Bottom / Accumulation Zone
Timeframe: 1W (Weekly)
Current Sentiment: Neutral to Bullish, depending on confirmation of a rebound from the yellow zone
🧠 Additional Notes
This accumulation zone may present a valuable opportunity for swing traders or long-term investors looking for entries at undervalued levels. However, it's crucial to wait for volume confirmation and a strong reversal candlestick pattern before entering.
#DGB #DGBUSDT #AltcoinAnalysis #CryptoWeekly #DoubleBottom #SupportZone #ReversalPattern #CryptoSignals
✅ Get Free Signals! Join Our Telegram Channel Here: t.me/TheCryptoNuclear
✅ Twitter: twitter.com/crypto_nuclear
✅ Join Bybit : partner.bybit.com/b/nuclearvip
✅ Benefits : Lifetime Trading Fee Discount -50%
✅ Twitter: twitter.com/crypto_nuclear
✅ Join Bybit : partner.bybit.com/b/nuclearvip
✅ Benefits : Lifetime Trading Fee Discount -50%
Disclaimer
The information and publications are not meant to be, and do not constitute, financial, investment, trading, or other types of advice or recommendations supplied or endorsed by TradingView. Read more in the Terms of Use.