DIA (Dow Jones ETF) - Weekly - Support, Resistance, Trendlines
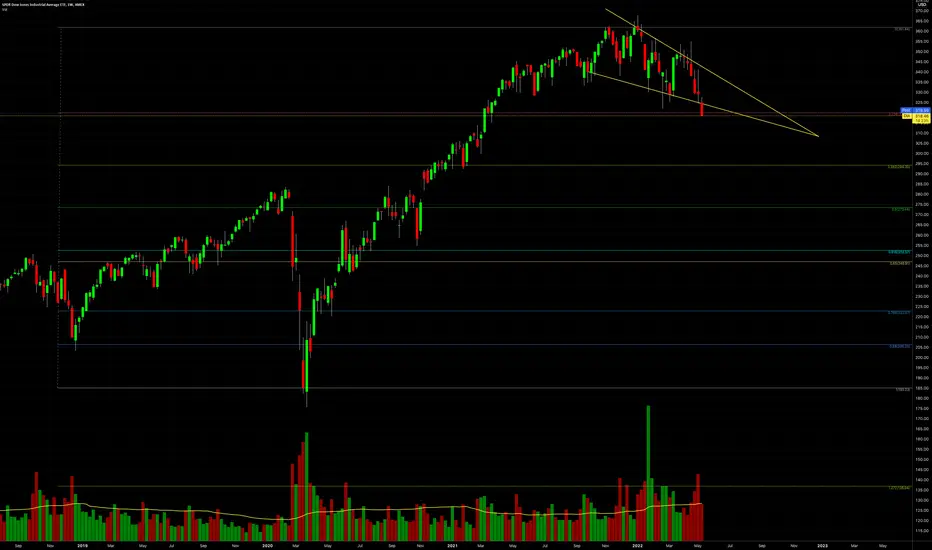
DIA (Dow Jones ETF) - Weekly chart.
Support, Resistance, Trendlines for reference.
05/11/2022.
Support, Resistance, Trendlines for reference.
05/11/2022.
Note
Bearish Head-and-Shoulders pattern in play.Follow Me on TradingView, Youtube, X, Instagram.
Social Media links are in my profile.
Boost, comment, share to support.
All posts are not financial advice.
Social Media links are in my profile.
Boost, comment, share to support.
All posts are not financial advice.
Disclaimer
The information and publications are not meant to be, and do not constitute, financial, investment, trading, or other types of advice or recommendations supplied or endorsed by TradingView. Read more in the Terms of Use.
Follow Me on TradingView, Youtube, X, Instagram.
Social Media links are in my profile.
Boost, comment, share to support.
All posts are not financial advice.
Social Media links are in my profile.
Boost, comment, share to support.
All posts are not financial advice.
Disclaimer
The information and publications are not meant to be, and do not constitute, financial, investment, trading, or other types of advice or recommendations supplied or endorsed by TradingView. Read more in the Terms of Use.