Technical Analysis Overview:
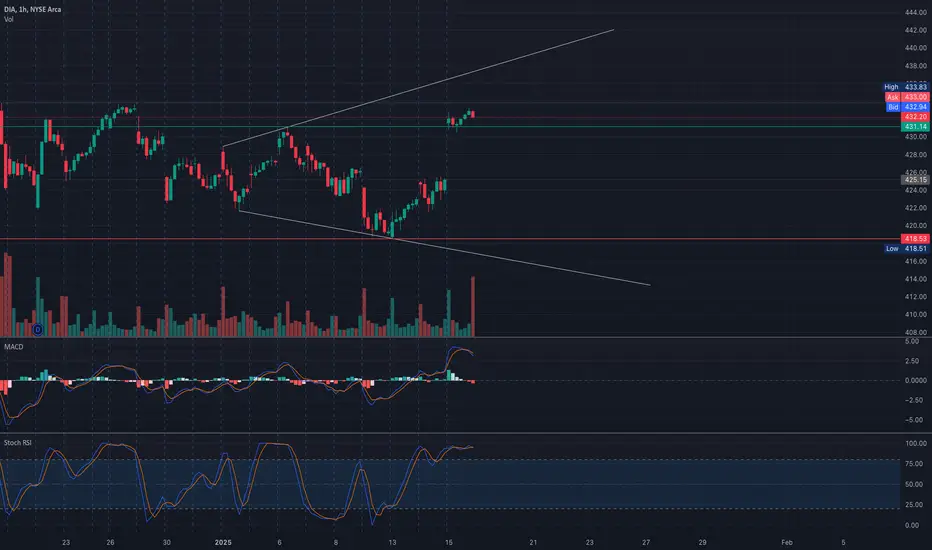
1-Hour Chart:
* Trend: DIA has broken out of a descending wedge pattern and is approaching resistance near $433.
* Indicators:
* MACD: Bullish momentum is weakening, with the histogram contracting.
* Stochastic RSI: Overbought, indicating a possible short-term pullback or consolidation.
30-Minute Chart:
* Price Action:
* DIA is trading near $433, a key resistance level, with support around $427.
* The breakout from consolidation has been supported by increasing volume.
Key Levels to Watch:
Support Levels:
* $427: Immediate support zone, also the HVL (highest volume level).
* $424: Strong PUT support level (-4.92% GEX).
* $419: Major support aligned with the 3rd PUT Wall.
Resistance Levels:
* $433: Immediate resistance, coinciding with the highest positive NETGEX level.
* $437: Next resistance zone (GEX7).
* $440: Major resistance aligning with the 3rd CALL Wall.
GEX Insights:

Key Gamma Levels:
* Positive Gamma Walls (Resistance):
* $433: Key resistance and the highest positive NETGEX.
* $437: 55.86% GEX (2nd CALL Wall).
* $440: 39.89% GEX (3rd CALL Wall).
* Negative Gamma Levels (Support):
* $427: Immediate support zone (-23.78% GEX).
* $424: Strong PUT Wall (-4.92% GEX).
* $419: Significant support level (-3.33% GEX).
Options Metrics:
* IVR: 22.6, reflecting low implied volatility.
* IVx: 14.5, well below average, indicating muted price fluctuations.
* Call/Put Bias: Puts dominate at 29.2%, indicating mixed sentiment.
Trade Scenarios:
Bullish Scenario:
* Entry: Above $433 with volume confirmation.
* Target: $437-$440.
* Stop-Loss: Below $427 to limit risk.
Bearish Scenario:
* Entry: Rejection at $433 or breakdown below $427.
* Target: $424-$419.
* Stop-Loss: Above $437 to control losses.
Directional Bias:
* DIA’s breakout above the descending wedge indicates bullish potential. However, the overbought Stochastic RSI suggests caution near $433 resistance. A confirmed breakout could lead to $437-$440, while a rejection may pull prices back to $427 or lower.
Conclusion:
DIA is at a critical resistance level near $433. Traders should monitor volume and momentum for a breakout or rejection. The gamma landscape supports further upside if $433 is cleared, but a failure to hold could lead to a retest of $427-$424.
1-Hour Chart:
* Trend: DIA has broken out of a descending wedge pattern and is approaching resistance near $433.
* Indicators:
* MACD: Bullish momentum is weakening, with the histogram contracting.
* Stochastic RSI: Overbought, indicating a possible short-term pullback or consolidation.
30-Minute Chart:
* Price Action:
* DIA is trading near $433, a key resistance level, with support around $427.
* The breakout from consolidation has been supported by increasing volume.
Key Levels to Watch:
Support Levels:
* $427: Immediate support zone, also the HVL (highest volume level).
* $424: Strong PUT support level (-4.92% GEX).
* $419: Major support aligned with the 3rd PUT Wall.
Resistance Levels:
* $433: Immediate resistance, coinciding with the highest positive NETGEX level.
* $437: Next resistance zone (GEX7).
* $440: Major resistance aligning with the 3rd CALL Wall.
GEX Insights:
Key Gamma Levels:
* Positive Gamma Walls (Resistance):
* $433: Key resistance and the highest positive NETGEX.
* $437: 55.86% GEX (2nd CALL Wall).
* $440: 39.89% GEX (3rd CALL Wall).
* Negative Gamma Levels (Support):
* $427: Immediate support zone (-23.78% GEX).
* $424: Strong PUT Wall (-4.92% GEX).
* $419: Significant support level (-3.33% GEX).
Options Metrics:
* IVR: 22.6, reflecting low implied volatility.
* IVx: 14.5, well below average, indicating muted price fluctuations.
* Call/Put Bias: Puts dominate at 29.2%, indicating mixed sentiment.
Trade Scenarios:
Bullish Scenario:
* Entry: Above $433 with volume confirmation.
* Target: $437-$440.
* Stop-Loss: Below $427 to limit risk.
Bearish Scenario:
* Entry: Rejection at $433 or breakdown below $427.
* Target: $424-$419.
* Stop-Loss: Above $437 to control losses.
Directional Bias:
* DIA’s breakout above the descending wedge indicates bullish potential. However, the overbought Stochastic RSI suggests caution near $433 resistance. A confirmed breakout could lead to $437-$440, while a rejection may pull prices back to $427 or lower.
Conclusion:
DIA is at a critical resistance level near $433. Traders should monitor volume and momentum for a breakout or rejection. The gamma landscape supports further upside if $433 is cleared, but a failure to hold could lead to a retest of $427-$424.
Disclaimer
The information and publications are not meant to be, and do not constitute, financial, investment, trading, or other types of advice or recommendations supplied or endorsed by TradingView. Read more in the Terms of Use.
Disclaimer
The information and publications are not meant to be, and do not constitute, financial, investment, trading, or other types of advice or recommendations supplied or endorsed by TradingView. Read more in the Terms of Use.