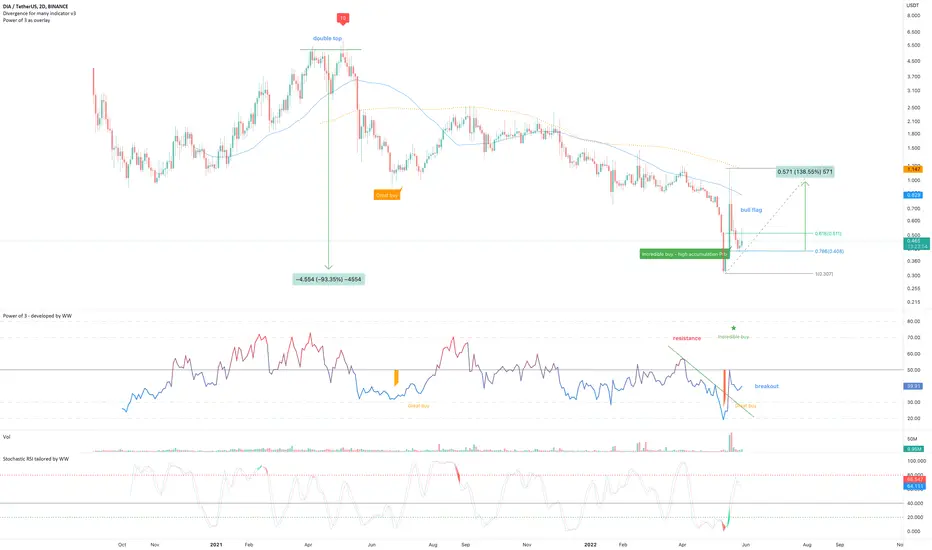
On the above 2-day chart price action has corrected 95% since the double top in May 2021. A number of reasons now exist to be long, including:
1) The ‘incredible buy’ signal.
2) Price action has now corrected to the 0.786 Fibonacci level following confirmation of the ‘buy’ signal.
3) A falling wedge pattern + breakout is confirmed.
4) Everything that was said above is also true for the BTC pair (below).
5) Nudge nudge wink wink. Don’t know what I mean? Shame.
Is it possible price action falls further? Sure.
Is it probable? Highly unlikely.
Good luck!
Ww
Type: trade
Risk: <=6% of portfolio
Timeframe: 1 - 3 months
Return: 10x
2-day BTC pair
Note
Correction on point 2) Bull flag, not wedge.Trade active
Trade active
Note
nudge nudge wink winkTrade active
What if conditions metTrade active
Price action breaks out of resistanceBTC
bc1q2eckdzh0q8vsd7swcc8et6ze7s99khhxyl7zwy
Weblink: patreon.com/withoutworries
Allow 3-6 months on ideas. Not investment advice. DYOR
bc1q2eckdzh0q8vsd7swcc8et6ze7s99khhxyl7zwy
Weblink: patreon.com/withoutworries
Allow 3-6 months on ideas. Not investment advice. DYOR
Related publications
Disclaimer
The information and publications are not meant to be, and do not constitute, financial, investment, trading, or other types of advice or recommendations supplied or endorsed by TradingView. Read more in the Terms of Use.
BTC
bc1q2eckdzh0q8vsd7swcc8et6ze7s99khhxyl7zwy
Weblink: patreon.com/withoutworries
Allow 3-6 months on ideas. Not investment advice. DYOR
bc1q2eckdzh0q8vsd7swcc8et6ze7s99khhxyl7zwy
Weblink: patreon.com/withoutworries
Allow 3-6 months on ideas. Not investment advice. DYOR
Related publications
Disclaimer
The information and publications are not meant to be, and do not constitute, financial, investment, trading, or other types of advice or recommendations supplied or endorsed by TradingView. Read more in the Terms of Use.