🔑 Key Highlights
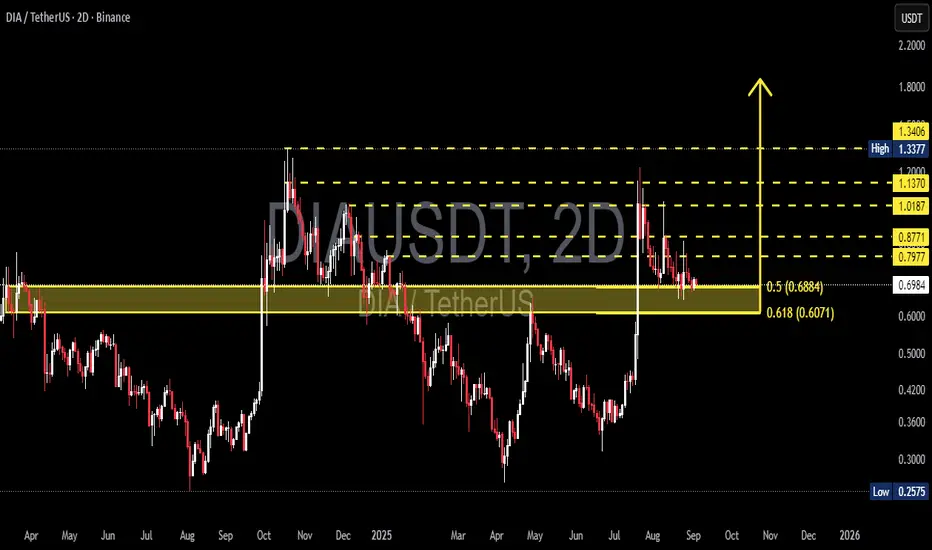
DIA price is currently testing the Fibonacci golden pocket (0.5–0.618) range around 0.6884 – 0.6071 USDT, a highly crucial zone that will decide whether the market resumes a bullish rally or extends the bearish trend.
This area also acts as a flip level (former resistance turned potential support). If buyers defend this level, a strong bounce may follow. But if it fails, the downside risk increases significantly.
---
📌 Structure & Technical Context
Major Support (Golden Pocket): 0.6884 – 0.6071.
Confluence of Fibonacci retracement and structural support.
Key Resistances: 0.7977 → 0.8771 → 1.0187 → 1.1370 → 1.3377 (recent high).
Candle Behavior: Multiple long wicks indicate liquidity grabs and indecision.
Trend Outlook: Medium-term remains sideways-to-bearish, but momentum can shift bullish if this golden pocket holds.
---
🚀 Bullish Scenario
Confirmation: 2D candle close above 0.70 with bullish reversal signals (hammer / engulfing) + increasing volume.
Upside Targets:
Target 1: 0.7977 (+14%).
Target 2: 1.0187 (+46%).
Target 3: 1.1370 – 1.3377 (+60–90%).
Plan:
Conservative entry near 0.68–0.70 with stop below 0.60. Use ladder take profits at each resistance level.
---
⚠️ Bearish Scenario
Confirmation: 2D close below 0.6071 (golden pocket breakdown).
Downside Targets:
First support: 0.42 (~40% drop).
Deeper support: 0.2575 (~63% drop).
Plan:
Short entry on confirmed breakdown + retest. Stop loss above 0.655, target 0.42 / 0.2575.
---
📈 Risk Management Notes
2D timeframe = swing trade context (weeks to months). Avoid reacting too much to small intraday candles.
Wait for candle + volume confirmation.
Take profits gradually and use trailing stops if resistance breaks.
Always size positions according to your personal risk tolerance.
---
DIA is testing the Fibonacci golden pocket (0.688–0.607), which also acts as a key flip level. This is a decisive battleground: will it turn into accumulation for a rally toward 0.7977 → 1.0187 → 1.1370, or will it break down toward 0.42 → 0.2575?
🔵 Bullish: needs a 2D close above 0.70 with strong reversal signals. Upside targets: 0.7977 → 1.0187 → 1.1370+.
🔴 Bearish: breakdown below 0.607 opens downside toward 0.42 → 0.2575.
This zone is where buyers and sellers will decide the next big move.
⛔️ Not financial advice. For educational purposes only.
#DIA #DIAUSDT #CryptoAnalysis #SwingTrade #Fibonacci #GoldenPocket #TechnicalAnalysis #PriceAction #Crypto
✅ Get Free Signals! Join Our Telegram Channel Here: t.me/TheCryptoNuclear
✅ Twitter: twitter.com/crypto_nuclear
✅ Join Bybit : partner.bybit.com/b/nuclearvip
✅ Benefits : Lifetime Trading Fee Discount -50%
✅ Twitter: twitter.com/crypto_nuclear
✅ Join Bybit : partner.bybit.com/b/nuclearvip
✅ Benefits : Lifetime Trading Fee Discount -50%
Disclaimer
The information and publications are not meant to be, and do not constitute, financial, investment, trading, or other types of advice or recommendations supplied or endorsed by TradingView. Read more in the Terms of Use.