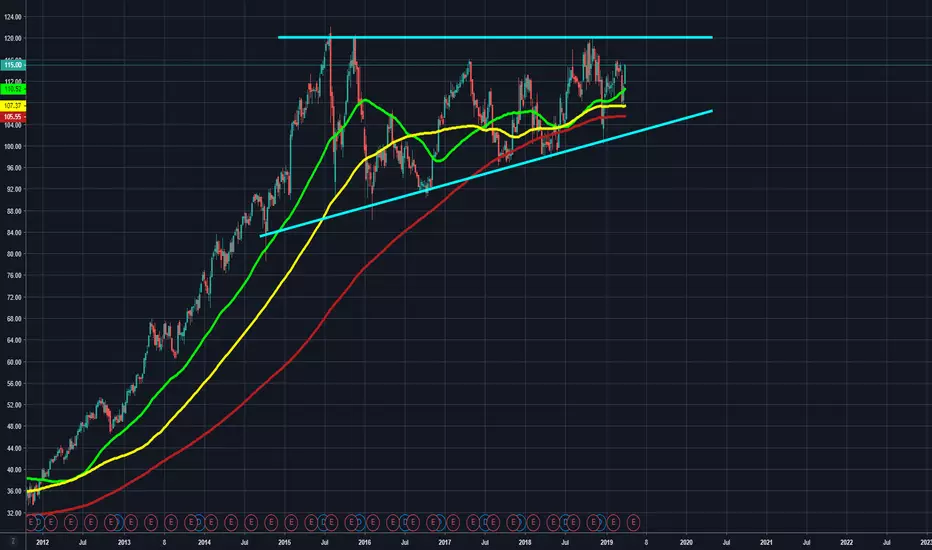
DIS (Disney) is currently within a weekly ascending triangle pattern. We've tested the flat-line of resistance around 120 three times, and we've tested the rising line of support about six times and buyers have shown up to defend it each and every time. It is now trading above the 50/100/200 weekly moving averages, and it appears it wants to test that flat resistance level around 120 again. I'm watching for a potential break up out of this ascending triangle pattern into a new price discovery phase.
Moving average guide (All Weekly for this post):
50 weekly moving average in Green.
100 weekly moving average in Yellow.
200 weekly moving average in Red.
-This is not financial advice. Always do your own research and own due-diligence before investing and trading, as for investing and trading comes with high amounts of risk. I am not liable for any incurred losses or financial distress.
Note
Broke through the flat line of resistance at 120, and we have now entered into a new price discovery phase: FTX US: ftx.us/
Sign up for Binance US here: binance.us/?ref=35000668
Sign up for Binance US here: binance.us/?ref=35000668
Disclaimer
The information and publications are not meant to be, and do not constitute, financial, investment, trading, or other types of advice or recommendations supplied or endorsed by TradingView. Read more in the Terms of Use.
FTX US: ftx.us/
Sign up for Binance US here: binance.us/?ref=35000668
Sign up for Binance US here: binance.us/?ref=35000668
Disclaimer
The information and publications are not meant to be, and do not constitute, financial, investment, trading, or other types of advice or recommendations supplied or endorsed by TradingView. Read more in the Terms of Use.