Too often, we exhaust ourselves asking, “What will this stock do next?” and “Why will it go up or down?” We scan headlines, debate macro trends, and craft elaborate forecasts, only to find the market moving in ways we never imagined.
This happens because, as retail investors, we don’t have access to all the information, and even if we did, we couldn’t process it for every stock. In other words, we’re always at a disadvantage.
But the moment anyone trade posts a price and volume, the market speaks for itself. We can learn to read these signals and act only when there’s a clear price trajectory, with an attractive risk–reward ratio.
📌 Key Takeaways from this Idea
📖 The Big Picture: Two Competing Narratives
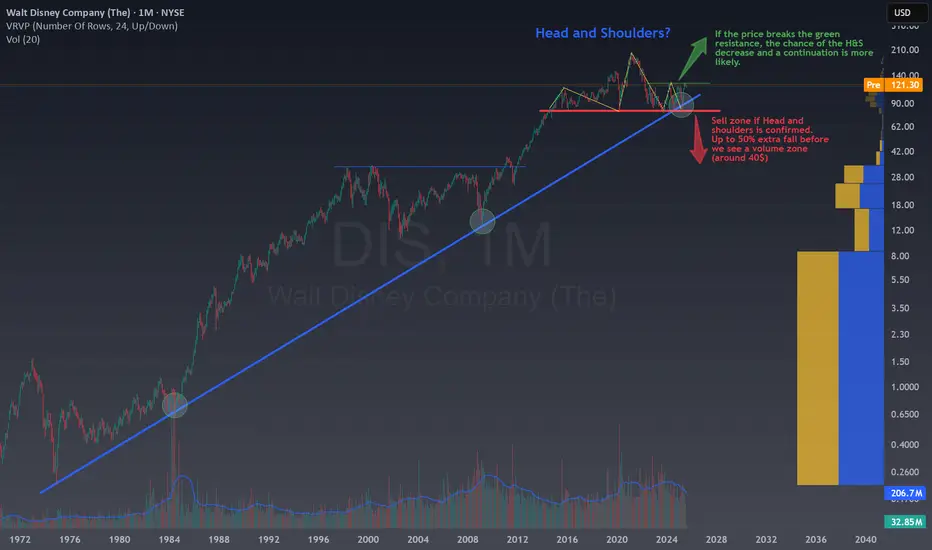
On Disney’s monthly chart, we see two powerful stories playing out:
Bearish Head & Shoulders
Left Shoulder around $215 (2021), Head near $205 (2022), Right Shoulder at $140 (2023–2024).
A clear break and close below $80 would confirm a classical reversal, potentially slicing Disney’s price by another 40–50% before hitting a strong volume cluster near $40 where the maximum prices of 2000's stand.
Bullish Long-Term Trend
Since the early 1980s, Disney has respected the upward sloping blue trend line (tested in 1984, 2009, 2020).
Today’s price (~$118) sits at that trend line and major horizontal support. If it holds, this could be the start of another leg toward unprecedented highs—driven by resumed park attendance, streaming profitability, and franchise power.
🏷️Why Price Zones Matter
“You don’t need to know where the market will go next, only where you will act.”
Buy Zone: $85 or over $120
Confluence of trend-line support + historical volume node.
Reward-to-Risk improves dramatically if we see bullish price action here (hammer, bullish engulfing).
Sell / Alert Zone: Under $80
Right-shoulder region, if price rallies back into this area but fails to break above, the head & shoulders pattern gains strength. Losing the red line support would be a major disaster for the DIS Stock.
Trigger Levels:
Bullish Confirmation: Monthly close above $120 → possible rally to $180–200+
Bearish Confirmation: Monthly close below $80 → path to $40–50
&S appeared:
Fortunately, most of the Head and Shoulders pattern end without breaking the support line, that means the pattern is not confirmed and the price continue bullish or neutral. But when the line is broken... Oh dear, be ready for the panic!
Let me show what happened to Novo Nordisk NVO when the pattern was confirmed:

Or to Tesla Inc. TSLA few yeras ago.

🤯Investor Psychology & Current Uncertainty
When a chart displays two clear narratives, each backed by its own pattern, it means the stock is in a moment of high uncertainty, and traders will operate within a price range until the outlook becomes clearer.
The reasons behind this two patterns:
Result: Investors are cautious, sitting on the sidelines, waiting for price to speak. A break above $120 might restore bullish conviction; a break below $80 could ignite panic selling.
🗺️ Trade Plan: Let Price Decide
In case you want to trade as soon as posible, consider playing the range, I mean, sell near 120$ to find some short term falls inside the channel. If not, don’t fight, just wait.
Above $120 → consider long exposures.
Below $80 → respect the bearish reversal. Consider short setups or stay out.
Use tight stops beyond your trigger level to guard against false breakouts.
“The market rewards the patient, let price do the talking.”
🤔 Conclusion
Disney stands at a historical crossroads. Are we witnessing the end of a decades-long uptrend, or the resumption of a legendary growth story? By focusing on well-defined price zones and letting the chart guide your decisions, you’ll be prepared for either scenario, without guessing where the market “should” go next and avoiding frustration.
🚀 If you enjoyed this analysis, feel free to follow and comment below. Let price tell us the next chapter in Disney’s epic saga!
This happens because, as retail investors, we don’t have access to all the information, and even if we did, we couldn’t process it for every stock. In other words, we’re always at a disadvantage.
But the moment anyone trade posts a price and volume, the market speaks for itself. We can learn to read these signals and act only when there’s a clear price trajectory, with an attractive risk–reward ratio.
📌 Key Takeaways from this Idea
- Focus on Price Zones, not on predicting the market’s next move. It's not the way to make money!
- Head & Shoulders at $118–$140 is an extremely bearish reversal if $80 breaks.
- Long-term Trend Line support (blue) suggests a possible historic rebound to fresh all-time highs.
- Patience Pays Off: Let price decide the direction, breakdown or breakout?
📖 The Big Picture: Two Competing Narratives
On Disney’s monthly chart, we see two powerful stories playing out:
Bearish Head & Shoulders
Left Shoulder around $215 (2021), Head near $205 (2022), Right Shoulder at $140 (2023–2024).
A clear break and close below $80 would confirm a classical reversal, potentially slicing Disney’s price by another 40–50% before hitting a strong volume cluster near $40 where the maximum prices of 2000's stand.
Bullish Long-Term Trend
Since the early 1980s, Disney has respected the upward sloping blue trend line (tested in 1984, 2009, 2020).
Today’s price (~$118) sits at that trend line and major horizontal support. If it holds, this could be the start of another leg toward unprecedented highs—driven by resumed park attendance, streaming profitability, and franchise power.
🏷️Why Price Zones Matter
“You don’t need to know where the market will go next, only where you will act.”
Buy Zone: $85 or over $120
Confluence of trend-line support + historical volume node.
Reward-to-Risk improves dramatically if we see bullish price action here (hammer, bullish engulfing).
Sell / Alert Zone: Under $80
Right-shoulder region, if price rallies back into this area but fails to break above, the head & shoulders pattern gains strength. Losing the red line support would be a major disaster for the
Trigger Levels:
Bullish Confirmation: Monthly close above $120 → possible rally to $180–200+
Bearish Confirmation: Monthly close below $80 → path to $40–50
&S appeared:
Fortunately, most of the Head and Shoulders pattern end without breaking the support line, that means the pattern is not confirmed and the price continue bullish or neutral. But when the line is broken... Oh dear, be ready for the panic!
Let me show what happened to Novo Nordisk
Or to Tesla Inc.
🤯Investor Psychology & Current Uncertainty
When a chart displays two clear narratives, each backed by its own pattern, it means the stock is in a moment of high uncertainty, and traders will operate within a price range until the outlook becomes clearer.
The reasons behind this two patterns:
- Streaming Profitability: Disney+ has reached critical scale, but content costs remain sky-high. Investors wonder: will margins ever justify the valuation?
- Theme Parks Rebound vs. Macro Risks: Parks & Resorts are back to pre-COVID attendance, yet recession fears and rising rates weigh on consumer spending.
- Franchise Fatigue or Franchise Strength?: Marvel, Star Wars, Pixar continue to drive revenue—but recent box-office flops have shaken confidence.
- Leadership Transition & Strategy: New CEO’s focus: cost-cutting vs. growth investment. Every quarterly update is scrutinized for signs of over- or under-commitment.
Result: Investors are cautious, sitting on the sidelines, waiting for price to speak. A break above $120 might restore bullish conviction; a break below $80 could ignite panic selling.
🗺️ Trade Plan: Let Price Decide
In case you want to trade as soon as posible, consider playing the range, I mean, sell near 120$ to find some short term falls inside the channel. If not, don’t fight, just wait.
Above $120 → consider long exposures.
Below $80 → respect the bearish reversal. Consider short setups or stay out.
Use tight stops beyond your trigger level to guard against false breakouts.
“The market rewards the patient, let price do the talking.”
🤔 Conclusion
Disney stands at a historical crossroads. Are we witnessing the end of a decades-long uptrend, or the resumption of a legendary growth story? By focusing on well-defined price zones and letting the chart guide your decisions, you’ll be prepared for either scenario, without guessing where the market “should” go next and avoiding frustration.
🚀 If you enjoyed this analysis, feel free to follow and comment below. Let price tell us the next chapter in Disney’s epic saga!
Disclaimer
The information and publications are not meant to be, and do not constitute, financial, investment, trading, or other types of advice or recommendations supplied or endorsed by TradingView. Read more in the Terms of Use.
Disclaimer
The information and publications are not meant to be, and do not constitute, financial, investment, trading, or other types of advice or recommendations supplied or endorsed by TradingView. Read more in the Terms of Use.