Disney is preparing for an explosive breakout! There is a lot going on this chart so lets break it down for you.
This first thing to note is this is the 3day chart. Therefore this market structure has been developing over the last 5 years!
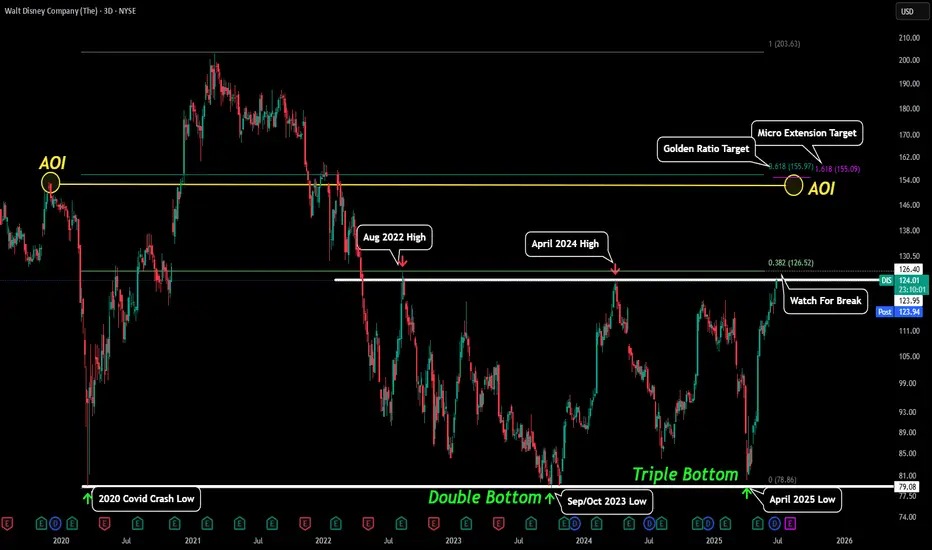
The first low of this mega trend was established during the Covid Crash of March 2020. It sent price from it low around $80 to over $200! The second low of our mega trend was established September/October 2023 Establishing a double bottom around the $80 level which sent the stock on a 60% rally. The third low was established during the tariff collapse in April 2025. This has also sent the stock on a 60% rally over the last couple months after establishing a TRIPLE BOTTOM around the $80 level. This shows Disney's stock has seen very strong demand at $80 over the past 5 years and has helped it develop a very strong floor of support (Lower white line).
The second thing we will be looking at is the highs of this mega trend, not the high above $200 but the high that created the first top on the structure at $126 in August of 2022. The second top was established at the same level in April 2024 creating a double top. This sent price crashing down 35% back to that floor of support at $80. Now price is right back at the same level.
This means it is extremely important to see how the stock price reacts at this level. If price fails to break above then that could establish a triple top at this level which could jeopardize the $80 floor of support.
However that is the less likely alternative and what is more likely is a breakout above this structure. Since this structure has been forming for so long it could create a swift breakout to the upside. If this is to occur our first primary level to watch will be around $155.
The $155 is a very important level and has lots of confluence giving us that as a potential first breakout target. AOI - This means area of interest and is highlighted by yellow circles. This AOI marked the top before the 2020 covid collapse. Looking at the purple line gives us the 1.618 extension level of our micro trend. On top of that It is also in confluence with the 0.618 golden ratio of our macro trend.
Keep an eye on this stock and its breakout potential.
This first thing to note is this is the 3day chart. Therefore this market structure has been developing over the last 5 years!
The first low of this mega trend was established during the Covid Crash of March 2020. It sent price from it low around $80 to over $200! The second low of our mega trend was established September/October 2023 Establishing a double bottom around the $80 level which sent the stock on a 60% rally. The third low was established during the tariff collapse in April 2025. This has also sent the stock on a 60% rally over the last couple months after establishing a TRIPLE BOTTOM around the $80 level. This shows Disney's stock has seen very strong demand at $80 over the past 5 years and has helped it develop a very strong floor of support (Lower white line).
The second thing we will be looking at is the highs of this mega trend, not the high above $200 but the high that created the first top on the structure at $126 in August of 2022. The second top was established at the same level in April 2024 creating a double top. This sent price crashing down 35% back to that floor of support at $80. Now price is right back at the same level.
This means it is extremely important to see how the stock price reacts at this level. If price fails to break above then that could establish a triple top at this level which could jeopardize the $80 floor of support.
However that is the less likely alternative and what is more likely is a breakout above this structure. Since this structure has been forming for so long it could create a swift breakout to the upside. If this is to occur our first primary level to watch will be around $155.
The $155 is a very important level and has lots of confluence giving us that as a potential first breakout target. AOI - This means area of interest and is highlighted by yellow circles. This AOI marked the top before the 2020 covid collapse. Looking at the purple line gives us the 1.618 extension level of our micro trend. On top of that It is also in confluence with the 0.618 golden ratio of our macro trend.
Keep an eye on this stock and its breakout potential.
Disclaimer
The information and publications are not meant to be, and do not constitute, financial, investment, trading, or other types of advice or recommendations supplied or endorsed by TradingView. Read more in the Terms of Use.
Disclaimer
The information and publications are not meant to be, and do not constitute, financial, investment, trading, or other types of advice or recommendations supplied or endorsed by TradingView. Read more in the Terms of Use.