Today, we will show our view on DIS; let's start with the Weekly view:

The price is above two key channels, and we don't spot any other Dynamic resistance zone for the price
On the 4hs chart:
We can see a clear Flag pattern supported on the secondary broken ascending channel. Based on the Fibo extensions we can draw, we expect a bullish movement first towards 200 and then 225
The green line represents our activation level for the setup; We will set our stop loss below the Flag pattern and break even when the price reaches a risk-reward ratio of 1:1
The price is above two key channels, and we don't spot any other Dynamic resistance zone for the price
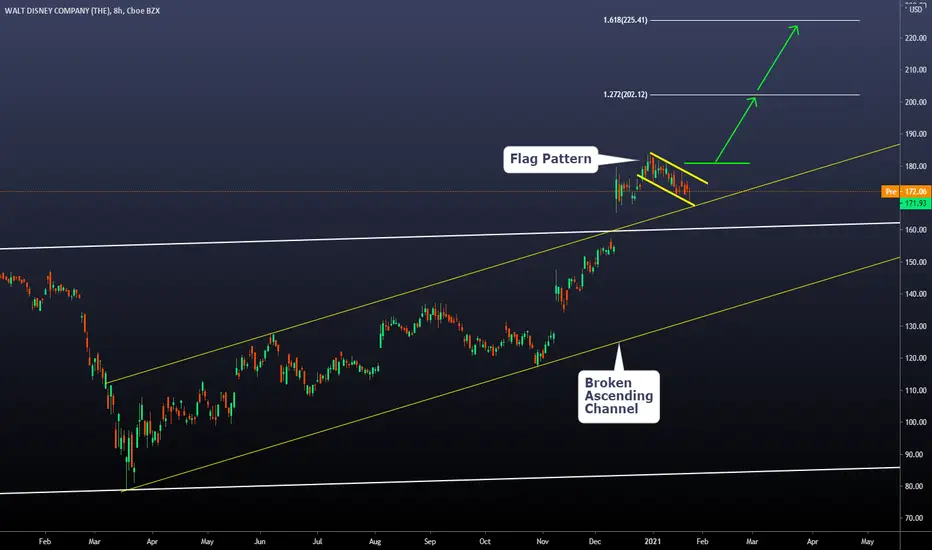
On the 4hs chart:
We can see a clear Flag pattern supported on the secondary broken ascending channel. Based on the Fibo extensions we can draw, we expect a bullish movement first towards 200 and then 225
The green line represents our activation level for the setup; We will set our stop loss below the Flag pattern and break even when the price reaches a risk-reward ratio of 1:1
Disclaimer
The information and publications are not meant to be, and do not constitute, financial, investment, trading, or other types of advice or recommendations supplied or endorsed by TradingView. Read more in the Terms of Use.
Disclaimer
The information and publications are not meant to be, and do not constitute, financial, investment, trading, or other types of advice or recommendations supplied or endorsed by TradingView. Read more in the Terms of Use.