📉 DIXON Technologies – Bearish Analysis
Timeframe: 15-minute
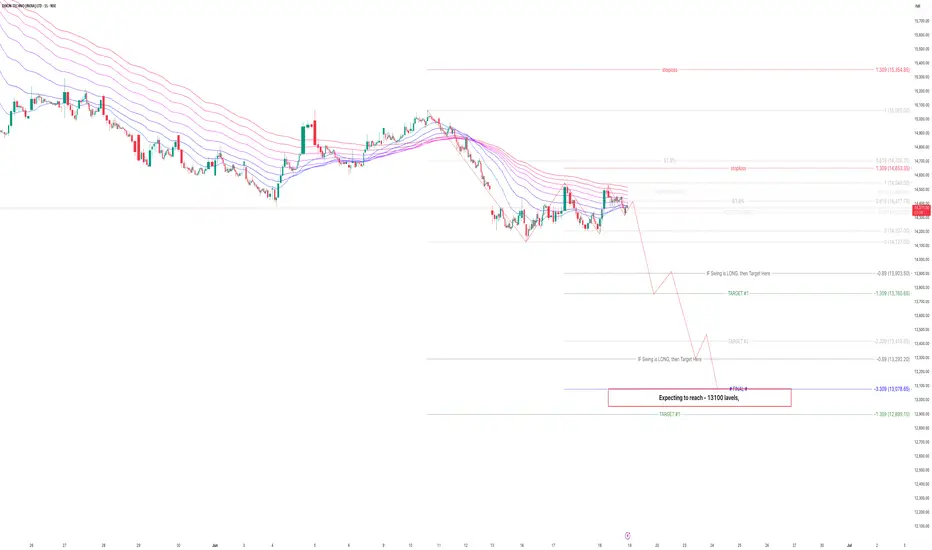
Trend: Clearly downward with consistent Lower Highs and Lower Lows
Indicators:
EMA Ribbon :
Price is currently below all EMAs, which are fanned out and sloping down — confirming strong bearish momentum.
EMA ribbon is acting as a dynamic resistance zone.
🧭 Key Chart Observations:
🔺 Resistance Zones:
₹14,588–14,706: Identified confluence of Fibonacci 61.8% retracements and previous supply zones.
Price rejected from this zone multiple times, validating it as a strong resistance.
🔻 Immediate Breakdown Zone:
₹14,350–14,400: Short-term demand zone where price is hovering.
Breakdown from this level will confirm continuation of the lower low structure.
🎯 Bearish Targets:
Target 1: ₹13,766
First minor support; aligns with Fibonacci -0.89 extension
Target 2: ₹13,292
Based on prior swing structure
Final Target: ₹13,078 – highlighted as your primary expectation
Extended Target: ₹12,899
Deep extension if breakdown continues with momentum
❗ Stoploss:
Above ₹14,653, which is just above the swing high and 61.8% Fib level — logical place to invalidate the bearish thesis.
📌 Strategy Suggestion:
Short Entry: Below ₹14,350 (confirmation breakdown)
Stoploss: ₹14,653 (above EMA resistance zone)
Targets:
T1: ₹13,766
T2: ₹13,292
Final: ₹13,078 (as per your marked level)
🔍 Summary:
DIXON is in a clear downtrend on the 15-min chart with EMA ribbon resistance, Fibonacci confluence rejection, and bearish swing structure. Unless price breaks above ₹14,653, downside momentum is likely to continue toward the ₹13,100–₹13,000 zone.
⚠️ Disclaimer:
This analysis is for educational and informational purposes only and does not constitute investment advice. Trading and investing in markets involve risk. Please do your own research or consult a financial advisor before making any trading decisions.
Timeframe: 15-minute
Trend: Clearly downward with consistent Lower Highs and Lower Lows
Indicators:
EMA Ribbon :
Price is currently below all EMAs, which are fanned out and sloping down — confirming strong bearish momentum.
EMA ribbon is acting as a dynamic resistance zone.
🧭 Key Chart Observations:
🔺 Resistance Zones:
₹14,588–14,706: Identified confluence of Fibonacci 61.8% retracements and previous supply zones.
Price rejected from this zone multiple times, validating it as a strong resistance.
🔻 Immediate Breakdown Zone:
₹14,350–14,400: Short-term demand zone where price is hovering.
Breakdown from this level will confirm continuation of the lower low structure.
🎯 Bearish Targets:
Target 1: ₹13,766
First minor support; aligns with Fibonacci -0.89 extension
Target 2: ₹13,292
Based on prior swing structure
Final Target: ₹13,078 – highlighted as your primary expectation
Extended Target: ₹12,899
Deep extension if breakdown continues with momentum
❗ Stoploss:
Above ₹14,653, which is just above the swing high and 61.8% Fib level — logical place to invalidate the bearish thesis.
📌 Strategy Suggestion:
Short Entry: Below ₹14,350 (confirmation breakdown)
Stoploss: ₹14,653 (above EMA resistance zone)
Targets:
T1: ₹13,766
T2: ₹13,292
Final: ₹13,078 (as per your marked level)
🔍 Summary:
DIXON is in a clear downtrend on the 15-min chart with EMA ribbon resistance, Fibonacci confluence rejection, and bearish swing structure. Unless price breaks above ₹14,653, downside momentum is likely to continue toward the ₹13,100–₹13,000 zone.
⚠️ Disclaimer:
This analysis is for educational and informational purposes only and does not constitute investment advice. Trading and investing in markets involve risk. Please do your own research or consult a financial advisor before making any trading decisions.
Disclaimer
The information and publications are not meant to be, and do not constitute, financial, investment, trading, or other types of advice or recommendations supplied or endorsed by TradingView. Read more in the Terms of Use.
Disclaimer
The information and publications are not meant to be, and do not constitute, financial, investment, trading, or other types of advice or recommendations supplied or endorsed by TradingView. Read more in the Terms of Use.