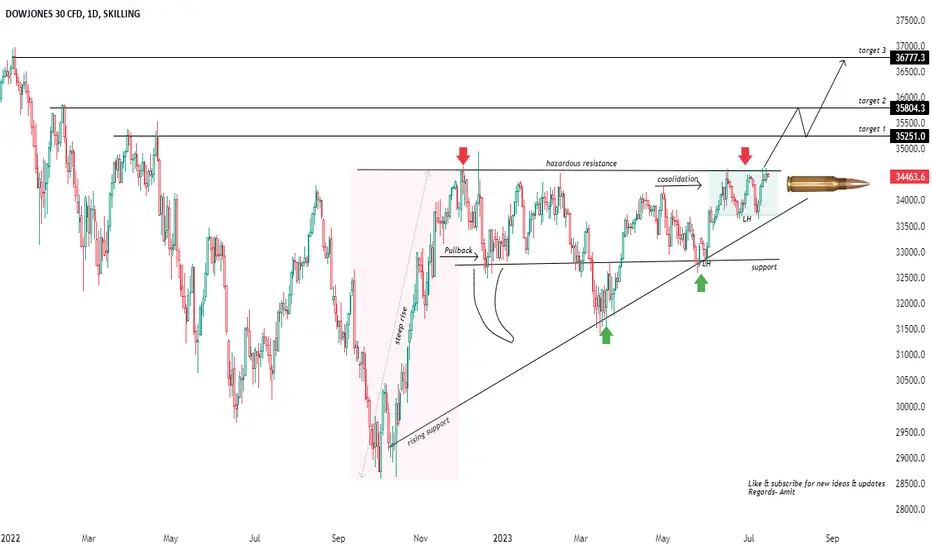
Hi mates, sharing daily chart of Dow jones as we saw too many upheavals after January 2022 after hitting a all time high of near 37000 levels and came down near to 29000 levels and try to rebound from September 2022 from near about 29000 levels it was a cut of almost 20% from top to that low and after did a sharp nonstop rally again to 34600 levels and took a resistance saw a pullback rally too after, so now i observed that price is trading near to that resistance again so if this resistance will break and price will sustain above we can see further rally near to all time high levels again targets i mentioned on chart.
KINDLY NOTE-: This is not and trade or investment advice. This publication is meant for only learning purpose.
Regards- Amit
KINDLY NOTE-: This is not and trade or investment advice. This publication is meant for only learning purpose.
Regards- Amit
Note
Nice move!! nice candle trading good above resistance hope it will close above and we will got a breakout, Now what are your views for it please share in comment box, thanks.Note
Dow fired some bears must have been injured, Jokes apart reached to mentioned target 1 and looking ready for target 2 because for targets i identified resistances so if target 1 break and sustain can do target 2 also keep on watch mates.Trade active
Breakout retested on last session on Friday now sustaining above on resistance based target one againNote
Price it seems consolidating between target one and target two you can see that on daily chart, i am sharing a snapshot of weekly chart reached 35731 near to mentioned target 35804 it was at 34463 when this idea was published, so after a break of target 2 we can see continuation of momentum it or can do a retest again to target 1Related publications
Disclaimer
The information and publications are not meant to be, and do not constitute, financial, investment, trading, or other types of advice or recommendations supplied or endorsed by TradingView. Read more in the Terms of Use.
Related publications
Disclaimer
The information and publications are not meant to be, and do not constitute, financial, investment, trading, or other types of advice or recommendations supplied or endorsed by TradingView. Read more in the Terms of Use.